In the past year the UK’s internet population has grown by more than two and a half million people according to data released by Kantar Media.
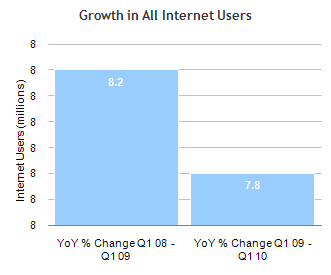
The first quarter of 2010 saw nearly 37 million people in the UK go online, an increase of almost 8% year on year.
This is an improvement on the YoY change from Q4 09 (5.9%) suggesting that internet take-up in the UK may not be as exhausted as expected.
Internet Users by Location
96% of the UK online universe accessed the internet from a fixed home connection, meaning 35.7 million people chose to go online from the comfort of home. Domestic internet users have grown by 8.3% in the past 12 months, while works users have only seen a 3.1% increase. Academic use has increased by 7.4% YoY.
| (millions) | 1st Qtr 08 | 1st Qtr 09 | 1st Qtr 10 | YoY % Change Q1 08 – Q1 09 | YoY % Change Q1 09 – Q1 10 |
| All users | 31.60 | 34.21 | 36.87 | 8.2 | 7.8 |
| Work users | 10.62 | 11.48 | 11.84 | 8.2 | 3.1 |
| Home users | 30.10 | 32.98 | 35.72 | 9.6 | 8.3 |
| Academic users | 2.34 | 3.53 | 3.80 | 51.2 | 7.4 |
Source: Kantar Media
Internet Users by Gender
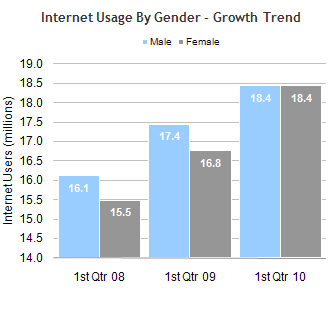
Female internet users have seen a 10% jump over the last year, finally equalling the number of men online. In the last twelve months female internet usage has grown by 1.67 million, while men have seen a rise of just under 1 million. In the past few years the gap between the sexes has been narrowly chipped away, resulting in an even fifty-fifty split for Q1 2010.
| (millions) | 1st Qtr 08 | 1st Qtr 09 | 1st Qtr 10 | YoY % Change Q1 08 – Q1 09 | YoY % Change Q1 09 – Q1 10 |
| Male | 16.12 | 17.45 | 18.43 | 8.2 | 5.7 |
| Female | 15.49 | 16.76 | 18.43 | 8.2 | 10.0 |
Source: Kantar Media
Internet Users by Age
Internet take-up for younger people seems to be slowing down. Q1 2009 – Q1 2010 saw 2.4% growth among the 15-24 age group, significantly down from 8.2% in Q1 2008- Q1 2009. There are currently 7 million 15-24 year olds in the UK. Every age group from 25-64 reported steady growth of 7.8% YoY. The over 65s saw a huge 21.2% rise in users, representing an extra 600,000 of those 65+ going online in the past 12 months.
| (millions) | 1st Qtr 08 | 1st Qtr 09 | 1st Qtr 10 | YoY % Change Q1 08 – Q1 09 | YoY % Change Q1 09 – Q1 10 |
| 15-24 | 6.32 | 6.84 | 7.00 | 8.2 | 2.4 |
| 25-34 | 6.32 | 6.84 | 7.37 | 8.2 | 7.8 |
| 35-44 | 7.27 | 7.53 | 8.11 | 3.5 | 7.8 |
| 45-54 | 5.37 | 5.82 | 6.27 | 8.2 | 7.8 |
| 55-64 | 3.79 | 4.45 | 4.79 | 17.2 | 7.8 |
| 65+ | 2.53 | 2.74 | 3.32 | 8.2 | 21.2 |
Source: Kantar Media
Internet Users by Social Grade
Broken down by class it is obvious that, although slowing down, the higher social classes display more exhausted internet penetration levels than their less well off equivalents. The AB social class has only seen a 4.2% increase over the past year while the DEs have grown by 13.4%.
| (millions) | 1st Qtr 08 | 1st Qtr 09 | 1st Qtr 10 | YoY % Change Q1 08 – Q1 09 | YoY % Change Q1 09 – Q1 10 |
| AB | 9.80 | 10.26 | 10.69 | 4.7 | 4.2 |
| C1 | 10.27 | 10.95 | 11.43 | 6.6 | 4.4 |
| C2 | 6.16 | 6.84 | 7.37 | 11.0 | 7.8 |
| DE | 5.37 | 6.50 | 7.37 | 21.0 | 13.4 |
Source: Kantar Media