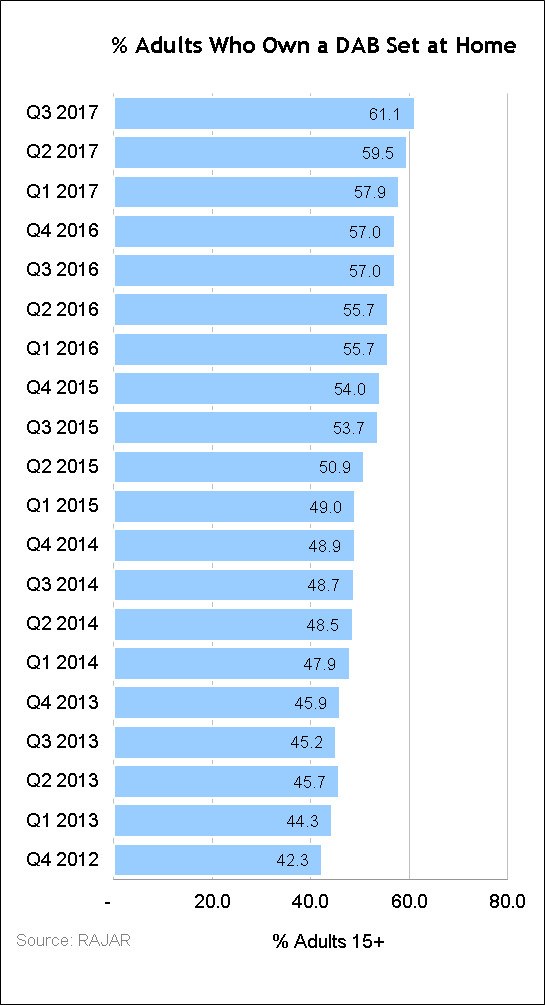

More than 6 in 10 adults (aged 15+) currently listen to radio via a digital platform, according to the latest Rajar results for the third quarter of 2017.
In total, 33 million people now tune in to radio via a digitally enabled receiver – DAB, digital TV or online – each week.
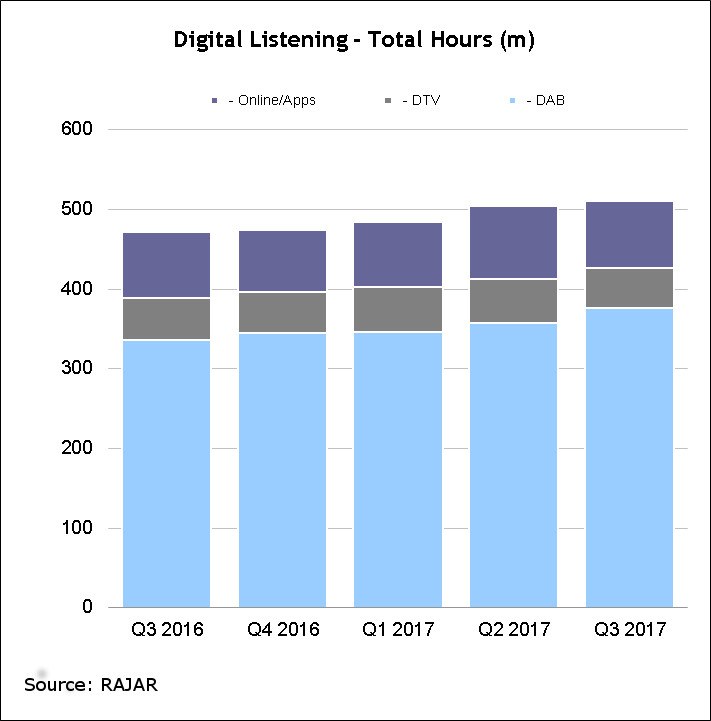
In an average week, digital listening accounts for 511 million hours; DAB has a 74% share of digital listening hours, digital TV 10% and online 16%.
In car digital listening exceeded 30% for the first time to reach a new record share of 30.9%. Digital listening in cars has contributed to 40.6% of all digital listening hourly growth.
In terms of online social interaction, a consistent 42% of 15-24 year old social media users claim to receive updates about their favourite radio station or presenter, with the figure slightly lower for the general adult population at 31%.
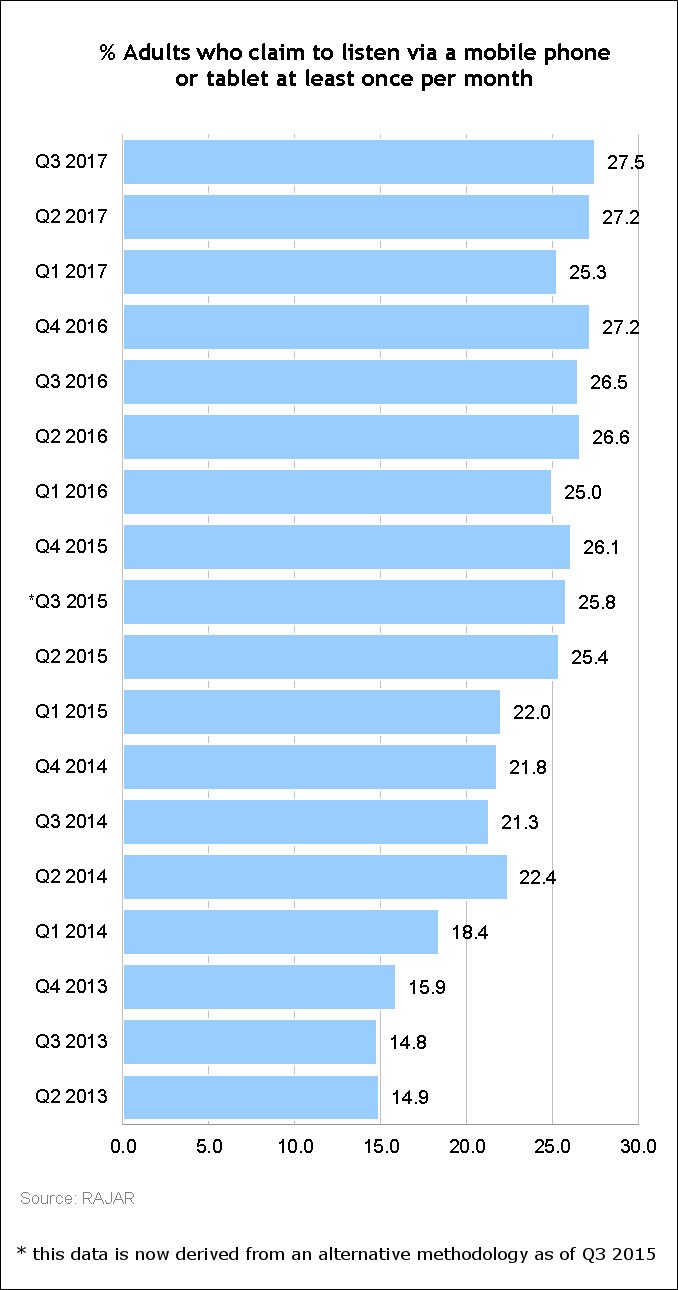
28% of UK adults say they listen to radio via a mobile phone or a tablet device, while 8.7 million adults keep things to themselves and only listen with earphones.
The most popular digital-only station is BBC 6 Music which recorded a weekly reach of 2.43 million listeners, followed by BBC Radio 4 Extra with a weekly reach of 2.15 million listeners – both record high figures.
Meanwhile, Kisstory is the most popular commercial digital-only station, with a record reach of 1.82 million listeners, with Absolute 80s taking the second spot with 1.53 million listeners.
| AM/FM | All Digital | – DAB | – DTV | – Online/Apps | |
|---|---|---|---|---|---|
| Platform Shares (%) | |||||
| Q3 2016 | 54.5 | 45.5 | 32.3 | 5.2 | 8.0 |
| Q4 2016 | 54.8 | 45.2 | 32.9 | 4.9 | 7.4 |
| Q1 2017 | 52.8 | 47.2 | 33.8 | 5.5 | 8.0 |
| Q2 2017 | 51.3 | 48.7 | 34.5 | 5.4 | 8.8 |
| Q3 2017 | 51.2 | 48.8 | 35.9 | 4.9 | 8.0 |
| Digital Listening Weekly Reach (%) | |||||
| Q3 2016 | n/a | 59.0 | 44.8 | 14.7 | 18.7 |
| Q4 2016 | n/a | 57.9 | 44.4 | 14.3 | 18.3 |
| Q1 2017 | n/a | 58.6 | 44.6 | 14.7 | 18.1 |
| Q2 2017 | n/a | 61.2 | 47.5 | 14.7 | 19.6 |
| Q3 2017 | n/a | 61.1 | 48.1 | 14.6 | 18.3 |
| Digital Listening Total Hours (m) | |||||
| Q3 2016 | n/a | 472.0 | 336.0 | 53.0 | 83.0 |
| Q4 2016 | n/a | 474.0 | 345.0 | 51.0 | 78.0 |
| Q1 2017 | n/a | 483.0 | 346.0 | 56.0 | 82.0 |
| Q2 2017 | n/a | 503.0 | 357.0 | 56.0 | 91.0 |
| Q3 2017 | n/a | 511.0 | 376.0 | 51.0 | 83.0 |
RAJAR
Note: **As of Q1 2016 a Platform Attribution model has been applied to the data which eliminates any “unspecified”