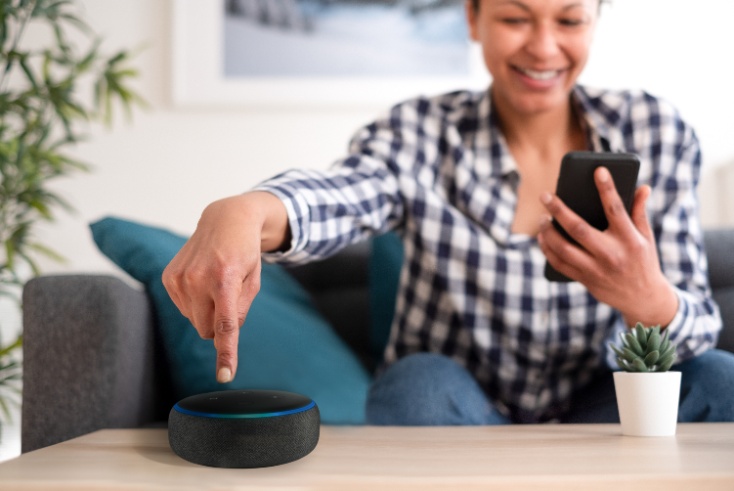

Smart speaker listening slightly declined quarter-on-quarter, now accounting for 13.8% of all listening, according to the latest Rajar audience data.
That is down from 14.4% last quarter. However, smart speakers’ weekly reach grew slightly quarter-on-quarter from 23.1% to 23.3%.
Total combined digital listening accounted for 70.3% of listening, mainly DAB (42.3%) but also online (24.2%).
Commercial radio recorded a 28.2% share of online listening compared to 19.1% for BBC Radio.
| AM/FM | All Digital | – DAB | – DTV | – Total Online | – Website / Apps | – Smart Speaker | |
|---|---|---|---|---|---|---|---|
| Platform Shares (%) | |||||||
| Q3 2022 | 34.0 | 66.0 | 38.9 | 3.6 | 23.6 | 10.2 | 13.4 |
| Q2 2023 | 31.4 | 68.6 | 40.3 | 3.5 | 24.9 | 10.5 | 14.4 |
| Q3 2023 | 29.7 | 70.3 | 42.3 | 3.8 | 24.2 | 10.4 | 13.8 |
| Digital Listening Weekly Reach (%) | |||||||
| Q3 2022 | n/a | 74.0 | 57.8 | 9.9 | 39.9 | 24.6 | 21.6 |
| Q2 2023 | n/a | 73.9 | 58.5 | 9.3 | 40.6 | 24.4 | 23.1 |
| Q3 2023 | n/a | 75.8 | 61.3 | 9.7 | 41.0 | 24.5 | 23.3 |
| Digital Listening Total Hours (m) | |||||||
| Q3 2022 | n/a | 674.0 | 397.0 | 36.0 | 241.0 | 104.0 | 137.0 |
| Q2 2023 | n/a | 697.0 | 409.0 | 36.0 | 253.0 | 106.0 | 146.0 |
| Q3 2023 | n/a | 714.0 | 429.0 | 38.0 | 246.0 | 106.0 | 140.0 |
Source: Rajar