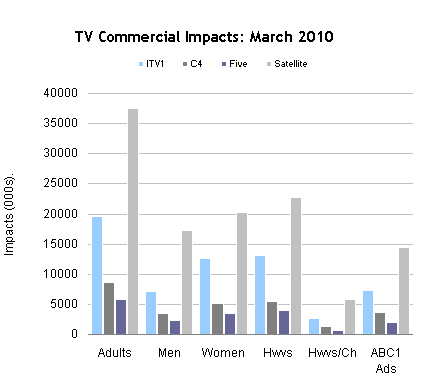
ITV1 enjoyed an impressive 20.3% year on year rise in revenue in March, to £105.4 million.
Channel 4’s revenue increased 18.4% year on year, to £51.4 million, up from £43.4 million in March 2009.
Revenue at Five was up 6.5% to £17.6 million, while GMTV saw a 9.2% increase, to £4.6 million.
Total terrestrial television revenue was almost £179 million, up 17.9% year on year.
| Total Revenue | Mar 09 | Mar 10 | % Change |
|---|---|---|---|
| ITV1 | 87,600,000 | 105,350,000 | 20.3 |
| C4 | 43,380,000 | 51,380,000 | 18.4 |
| Five | 16,530,000 | 17,600,000 | 6.5 |
| GMTV | 4,230,000 | 4,620,000 | 9.2 |
| Total Terrestrial (inc. GMTV) | 151,740,000 | 178,950,000 | 17.9 |
| Total Satellite | 78,540,000 | 99,220,000 | 26.3 |
Source: Agency Estimates
ITV Franchises
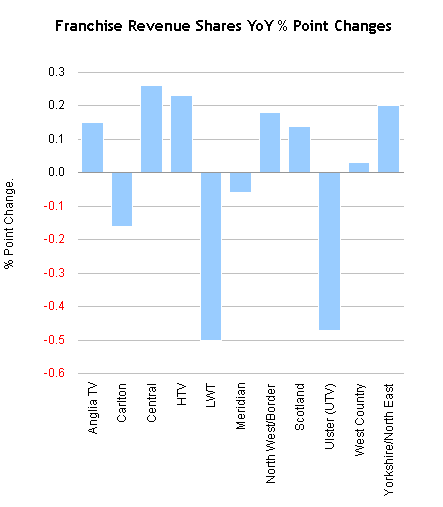
Central recorded the largest revenue share increase, up 0.26 percentage points to 15.30% in March.
HTV was up 0.23 percentage points to 6.66%, while Yorkshire/North East grew 0.20 percentage points to 10.80%.
Six of the ITV franchise regions provided revenue share of more than 10%.
Carlton provided a 15.11% share, down 0.16 percentage points, while LWT and Meridian provided shares of 11.40% and 11.58% respectively.
North West/Border was up 0.18 percentage points, to 10.25%.
| % Share of ITV Revenue by Franchise | Mar 09 | Mar 10 | % Point Change |
|---|---|---|---|
| Anglia TV | 7.40 | 7.55 | 0.15 |
| Carlton | 15.27 | 15.11 | -0.16 |
| Central | 15.04 | 15.30 | 0.26 |
| HTV | 6.43 | 6.66 | 0.23 |
| LWT | 11.90 | 11.40 | -0.50 |
| Meridian | 11.64 | 11.58 | -0.06 |
| North West/Border | 10.07 | 10.25 | 0.18 |
| Scotland | 6.43 | 6.57 | 0.14 |
| Ulster (UTV) | 3.19 | 2.72 | -0.47 |
| West Country | 2.03 | 2.06 | 0.03 |
| Yorkshire/North East | 10.60 | 10.80 | 0.20 |
Costs Per Thousand
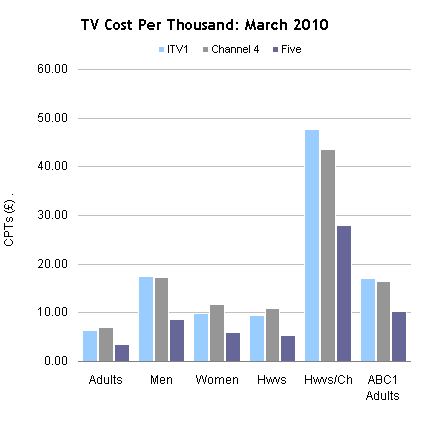
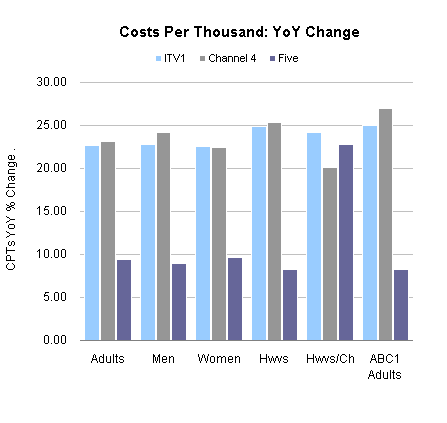
In March there were increases in ITV1’s CPT price for all of our featured audiences. ABC1 Adults saw the largest rise, up 25% year on year.
There were also across the board increases for Channel 4 and, as with ITV1, the largest rise (+26.9%) was for ABC1 Adults.
It was the same story with Five, as the channel recorded rises for all audiences, although its largest increase was for the Housewives with Children audience, up 22.8%
| CPTs | Adults | Men | Women | Hwvs | Hwvs/Ch | ABC1 Adults |
|---|---|---|---|---|---|---|
| ITV1 | 6.31 | 17.49 | 9.86 | 9.45 | 47.66 | 17.02 |
| % Ch YoY | 22.6 | 22.8 | 22.5 | 24.9 | 24.2 | 25.0 |
| Channel 4 | 6.97 | 17.28 | 11.67 | 10.90 | 43.49 | 16.44 |
| % Ch YoY | 23.1 | 24.2 | 22.4 | 25.4 | 20.1 | 26.9 |
| Five | 3.55 | 8.61 | 6.05 | 5.30 | 27.94 | 10.23 |
| % Ch YoY | 9.4 | 9.0 | 9.7 | 8.2 | 22.8 | 8.3 |
Commercial Impacts
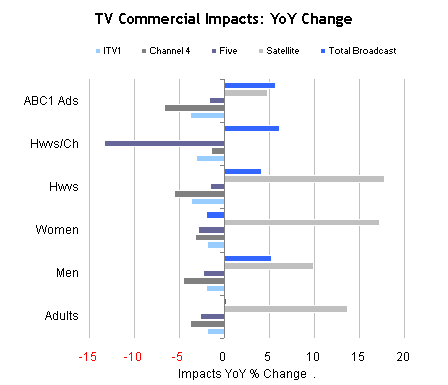
March saw commercial impacts at ITV1 fall year on year across all our featured audiences. The largest fall was in the ABC1 Adults category, down 3.8%.
There were also across the board declines for Channel 4. The largest came in the ABC1 Adults category, falling 6.7%.
Five’s commercial impacts were also down across our featured audiences, with Housewives with Children down a relatively large 13.3%.
Total Broadcast commercial impacts were up in all categories bar Women. The biggest increase was for Housewives with Children, up 6.1%.
| Impacts | Adults | Men | Women | Hwvs | Hwvs/Ch | ABC1 Adults |
|---|---|---|---|---|---|---|
| ITV1 | 19,650 | 7,085 | 12,565 | 13,113 | 2,601 | 7,282 |
| % Ch YoY | -1.9 | -2.0 | -1.9 | -3.7 | -3.2 | -3.8 |
| C4 | 8,678 | 3,497 | 5,180 | 5,543 | 1,390 | 3,677 |
| % Ch YoY | -3.8 | -4.6 | -3.2 | -5.6 | -1.4 | -6.7 |
| Five | 5,829 | 2,404 | 3,425 | 3,906 | 741 | 2,024 |
| % Ch YoY | -2.7 | -2.3 | -2.9 | -1.6 | -13.3 | -1.7 |
| Satellite | 37,497 | 17,285 | 20,212 | 22,778 | 5,795 | 14,514 |
| % Ch YoY | 13.7 | 9.9 | 17.2 | 17.8 | 0.1 | 4.7 |
| Total Broadcast | 28,125 | 73,264 | 10,844 | 30,710 | 42,554 | 46,520 |
| % Ch YoY | 0.2 | 5.3 | -2.0 | 4.1 | 6.1 | 5.7 |