


Channel 5 had a bumper month in March with revenues up 22.4% compared to this time last year.
The broadcaster struggled in the initial handover period after RTL sold to Richard Desmond in July 2010 for £103.5 million. Revenues were down from July to November.
However, it has had an impressive start to this year – with revenues up by 16.6% YoY in February and by 22.4% YoY in March.
ITV1 also enjoyed an increase in March – up 2.6% YoY, as did ITV Breakfast – up 8%. ITV1 featured in the top 10 programme rankings six times in March with popular shows Dancing on Ice, Wild at Heart and Benidorm.
However, it wasn’t all good news for the terrestrial broadcasters – Channel 4 saw revenues fall again.
After posting the highest percentage increase in December (up 10.4%), Channel 4 posted a 4.6% YoY drop in February and a 0.2% decline in March.
Overall terrestrial revenue was up 3.9% during the month, while total satellite was up 11% YoY.
Network Revenue
| Total Revenue | Mar 10 | Mar 11 | % Change |
|---|---|---|---|
| ITV1 | 105,350,000 | 108,090,000 | 2.6 |
| C4 | 51,380,000 | 51,270,000 | -0.2 |
| Five | 17,600,000 | 21,550,000 | 22.4 |
| ITV Breakfast | 4,620,000 | 4,990,000 | 8.0 |
| Total Terrestrial (inc. ITV Breakfast | 178,950,000 | 185,900,000 | 3.9 |
| Total Satellite | 99,220,000 | 110,110,000 | 11.0 |
Source: Agency Estimates
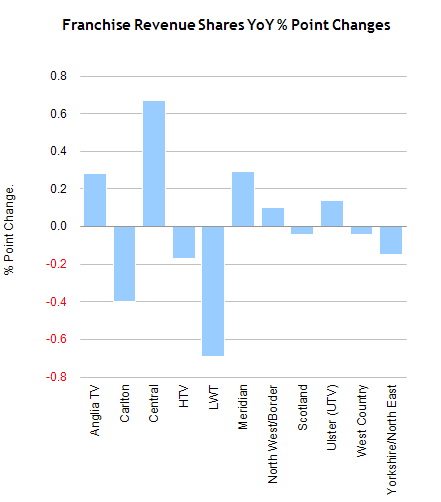
ITV Franchise Area
| % Share of ITV Revenue by Franchise | Feb 10 | Feb 11 | % Point Change |
|---|---|---|---|
| Anglia TV | 7.55 | 7.83 | 0.28 |
| Carlton | 15.11 | 14.71 | -0.40 |
| Central | 15.30 | 15.97 | 0.67 |
| HTV | 6.66 | 6.49 | -0.17 |
| LWT | 11.40 | 10.71 | -0.69 |
| Meridian | 11.58 | 11.87 | 0.29 |
| North West/Border | 10.25 | 10.35 | 0.10 |
| Scotland | 6.57 | 6.53 | -0.04 |
| Ulster (UTV) | 2.72 | 2.86 | 0.14 |
| West Country | 2.06 | 2.02 | -0.04 |
| Yorkshire/North East | 10.80 | 10.65 | -0.15 |
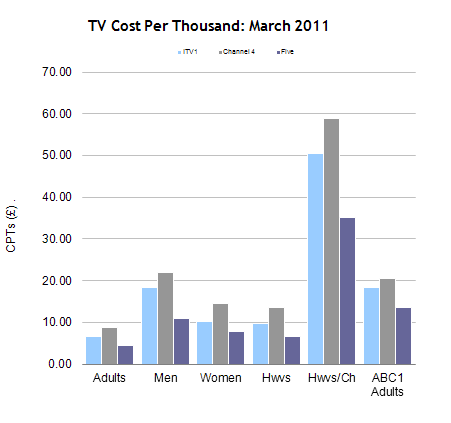
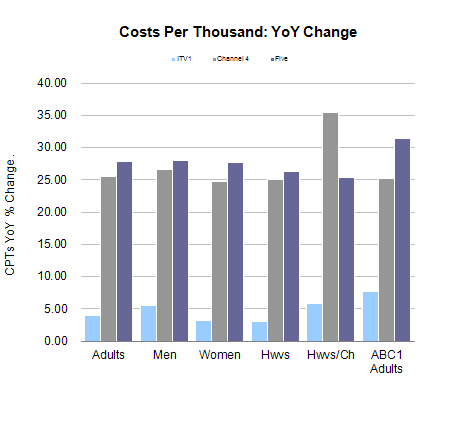
Network CPTs
| CPTs | Adults | Men | Women | Hwvs | Hwvs/Ch | ABC1 Adults |
|---|---|---|---|---|---|---|
| ITV1 | 6.56 | 18.45 | 10.17 | 9.74 | 50.42 | 18.34 |
| % Ch YoY | 3.95 | 5.46 | 3.12 | 3.09 | 5.80 | 7.75 |
| Channel 4 | 8.74 | 21.87 | 14.56 | 13.63 | 58.93 | 20.58 |
| % Ch YoY | 25.51 | 26.56 | 24.81 | 25.00 | 35.48 | 25.15 |
| Five | 4.54 | 11.02 | 7.72 | 6.69 | 35.04 | 13.44 |
| % Ch YoY | 27.79 | 27.94 | 27.69 | 26.26 | 25.42 | 31.39 |
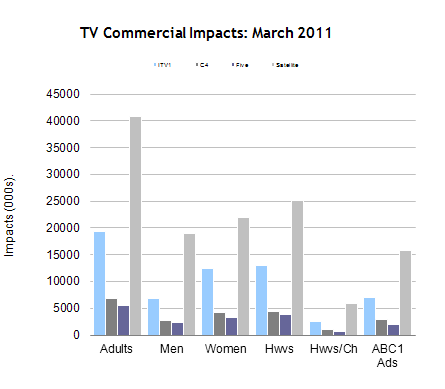
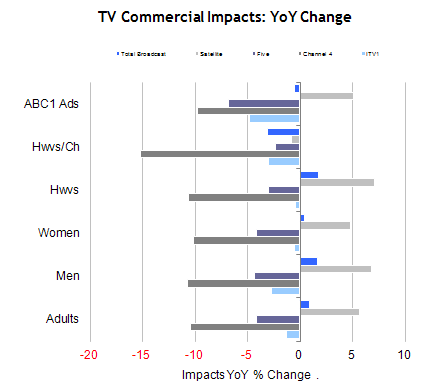
Commercial Impacts
| Impacts | Adults | Men | Women | Hwvs | Hwvs/Ch | ABC1 Adults |
|---|---|---|---|---|---|---|
| ITV1 | 19,394.10 | 6,893.39 | 12,500.72 | 13,050.83 | 2,522.10 | 6,933.72 |
| % Ch YoY | -1.30 | -2.71 | -0.51 | -0.47 | -3.02 | -4.78 |
| C4 | 6,899.19 | 2,757.51 | 4,141.68 | 4,425.24 | 1,023.65 | 2,931.48 |
| % Ch YoY | -10.40 | -10.75 | -10.17 | -10.58 | -15.18 | -9.75 |
| Five | 5,585.41 | 2,300.81 | 3,284.59 | 3,788.34 | 723.55 | 1,886.07 |
| % Ch YoY | -4.18 | -4.29 | -4.11 | -3.02 | -2.38 | -6.81 |
| Satellite | 40,863.92 | 18,980.75 | 21,883.15 | 25,156.90 | 5,964.33 | 15,775.16 |
| % Ch YoY | 5.70 | 6.78 | 4.79 | 7.12 | -0.77 | 5.11 |
| Total Broadcast | 74,124.63 | 31,297.62 | 42,827.01 | 47,435.11 | 10,535.87 | 28,054.07 |
| % Ch YoY | 0.92 | 1.64 | 0.40 | 1.72 | -3.14 | -0.49 |
TV market data is available in mediatel.co.uk’s TV Database.





