


Channel 5 has had another bumper month under owner Richard Desmond, with revenue up 14.9% compared to this time last year.
Following months of poor results last year, the broadcaster is now enjoying a turn of fortune – with revenues up 16.6% YoY in February; 22.4% YoY in March; and 41.7% YoY in April.
Aside from Channel 5, network revenue was down across the board in May – a turnaround from April’s results. Channel 4 posted the biggest YoY drop, down 14.5%.
ITV1 saw revenues fall 8.4% YoY, while ITV Breakfast posted a 6.5% YoY decline.
Overall, terrestrial revenue was down 7.7% in May, while total satellite was down 1.5%.
Network Revenue
| Total Revenue | May 10 | May 11 | % Change |
|---|---|---|---|
| ITV1 | 123,070,000 | 112,740,000 | -8.4 |
| C4 | 60,540,000 | 51,750,000 | -14.5 |
| Five | 21,360,000 | 24,550,000 | 14.9 |
| ITV Breakfast | 4,900,000 | 4,580,000 | -6.5 |
| Total Terrestrial (inc. ITV Breakfast | 209,870,000 | 193,620,000 | -7.7 |
| Total Satellite | 117,010,000 | 115,220,000 | -1.5 |
Source: Agency Estimates
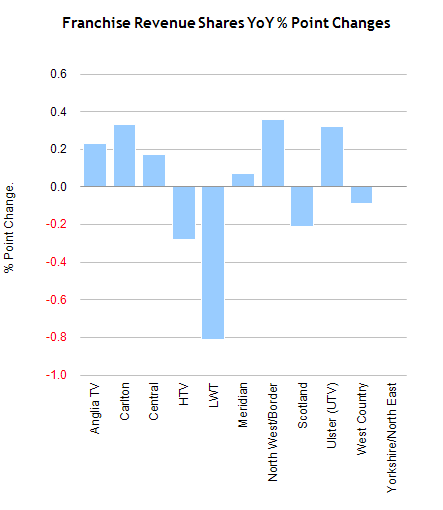
ITV Franchise Area
| % Share of ITV Revenue by Franchise | May 10 | May 11 | % Point Change |
|---|---|---|---|
| Anglia TV | 7.65 | 7.88 | 0.23 |
| Carlton | 12.83 | 13.16 | 0.33 |
| Central | 15.62 | 15.79 | 0.17 |
| HTV | 6.65 | 6.37 | -0.28 |
| LWT | 13.75 | 12.94 | -0.81 |
| Meridian | 11.80 | 11.87 | 0.07 |
| North West/Border | 10.29 | 10.65 | 0.36 |
| Scotland | 6.34 | 6.13 | -0.21 |
| Ulster (UTV) | 2.37 | 2.69 | 0.32 |
| West Country | 2.04 | 1.95 | -0.09 |
| Yorkshire/North East | 10.65 | 10.65 | n/a |
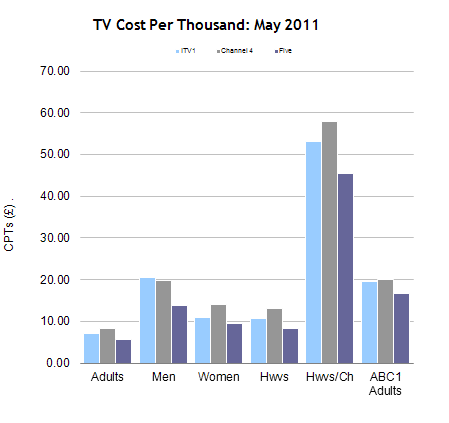
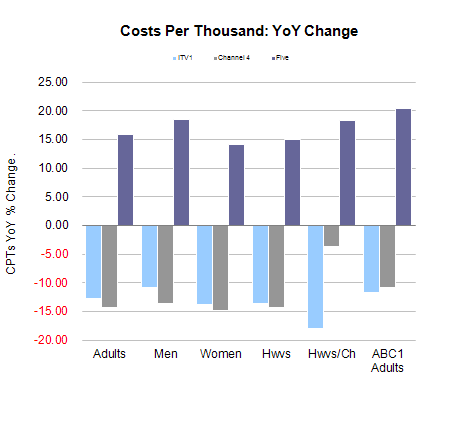
Network CPTs
| CPTs | Adults | Men | Women | Hwvs | Hwvs/Ch | ABC1 Adults |
|---|---|---|---|---|---|---|
| ITV1 | 7.14 | 20.45 | 10.96 | 10.58 | 52.99 | 19.50 |
| % Ch YoY | -12.78 | -10.76 | -13.86 | -13.72 | -18.02 | -11.70 |
| Channel 4 | 8.19 | 19.83 | 13.96 | 12.96 | 57.80 | 20.10 |
| % Ch YoY | -14.33 | -13.68 | -14.78 | -14.41 | -3.71 | -10.85 |
| Five | 5.59 | 13.79 | 9.41 | 8.20 | 45.39 | 16.60 |
| % Ch YoY | 15.82 | 18.41 | 14.05 | 14.96 | 18.33 | 20.35 |
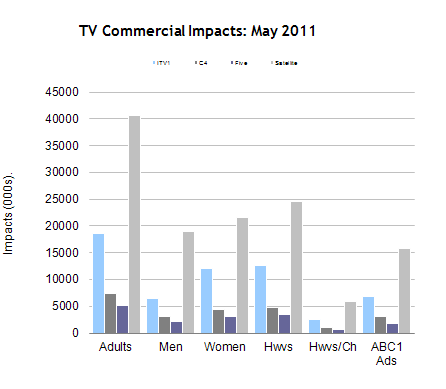
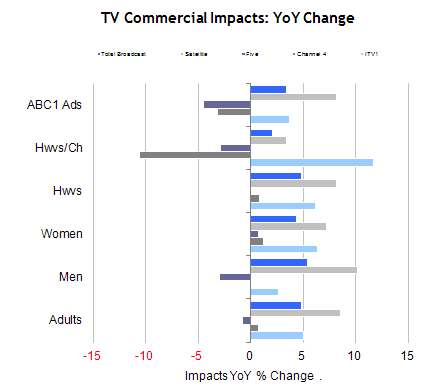
Commercial Impacts
| Impacts | Adults | Men | Women | Hwvs | Hwvs/Ch | ABC1 Adults |
|---|---|---|---|---|---|---|
| ITV1 | 18,583.87 | 6,486.78 | 12,097.06 | 12,534.73 | 2,503.05 | 6,801.09 |
| % Ch YoY | 5.03 | 2.65 | 6.35 | 6.16 | 11.74 | 3.74 |
| C4 | 7,433.07 | 3,070.75 | 4,362.31 | 4,698.00 | 1,053.44 | 3,029.42 |
| % Ch YoY | 0.75 | 0.02 | 1.27 | 0.86 | -10.53 | -3.10 |
| Five | 5,162.48 | 2,093.88 | 3,068.59 | 3,522.34 | 636.28 | 1,739.90 |
| % Ch YoY | -0.76 | -2.94 | 0.77 | -0.02 | -2.86 | -4.50 |
| Satellite | 40,533.00 | 18,939.91 | 21,592.85 | 24,571.05 | 5,855.02 | 15,734.37 |
| % Ch YoY | 8.60 | 10.21 | 7.22 | 8.19 | 3.43 | 8.23 |
| Total Broadcast | 71,404.77 | 30,333.77 | 41,070.73 | 45,261.33 | 10,040.66 | 27,086.43 |
| % Ch YoY | 4.85 | 5.44 | 4.41 | 4.84 | 2.09 | 3.41 |
TV market data is available in mediatel.co.uk’s TV Database.





