November saw ITV1’s revenue fall 0.6%, with a similar story the rest of the commercial broadcasters.
ITV1’s revenue was down 0.6% in November, to around £121.9 million.
Towards the end of the month, ITV took full control of breakfast broadcaster GMTV after securing the remaining 25% equity stake in the business from Disney. However, for the full month GMTV’s revenues were down 8.8% year on year, to £5.4 million.
Channel 4 also suffered a dip in revenue, down 7% year on year, to £54.5 million, while there was a pretty big fall for Five, down 21.5% year on year to under £24 million.
| Total Revenue | Nov 08 | Nov 09 | % Change |
|---|---|---|---|
| ITV1 | 122,610,000 | 121,930,000 | -0.6 |
| C4 | 58,600,000 | 54,500,000 | -7.0 |
| Five | 29,910,000 | 23,470,000 | -21.5 |
| GMTV | 5,930,000 | 5,410,000 | -8.8 |
| Total Terrestrial (inc. GMTV) | 217,050,000 | 205,310,000 | -5.4 |
| Total Satellite | 100,930,000 | 107,160,000 | 6.2 |
Source: Agency Estimates
ITV Franchises
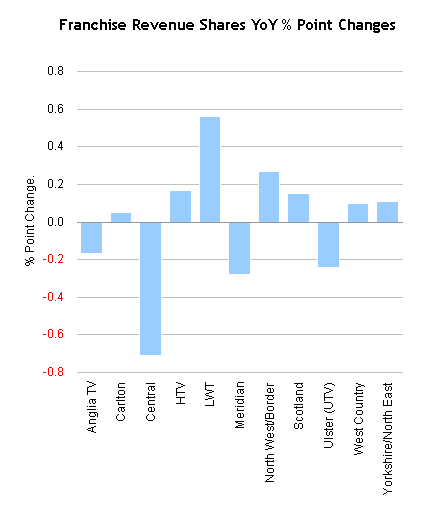
Looking at the ITV franchise regions, Central provided revenue share of 15.62%, although it was down by around 0.71 percentage points year on year, with five other regions also providing a share of 10% or more.
West Country enjoyed a slight increase in revenue share, up 0.10 percentage points year on year to 2.07%.
Elsewhere, Carlton, HTV, North West/Border and Scotland also saw increases in the share of revenue they provide.
| % Share of ITV Revenue by Franchise | Nov 08 | Nov 09 | % Point Change |
|---|---|---|---|
| Anglia TV | 7.75 | 7.58 | -0.17 |
| Carlton | 13.81 | 13.86 | 0.05 |
| Central | 16.33 | 15.62 | -0.71 |
| HTV | 6.09 | 6.26 | 0.17 |
| LWT | 12.17 | 12.73 | 0.56 |
| Meridian | 11.71 | 11.34 | -0.28 |
| North West/Border | 10.28 | 10.55 | 0.27 |
| Scotland | 6.43 | 6.58 | 0.15 |
| Ulster (UTV) | 2.92 | 2.68 | -0.24 |
| West Country | 1.97 | 2.07 | 0.10 |
| Yorkshire/North East | 10.54 | 10.65 | -0.11 |
Costs Per Thousand
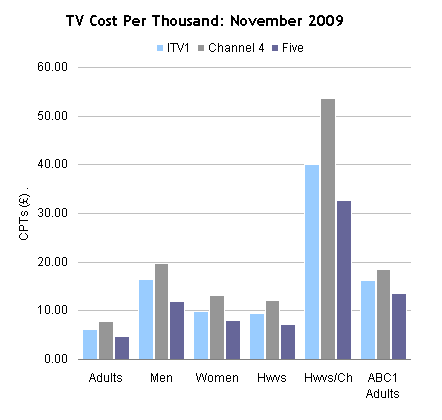
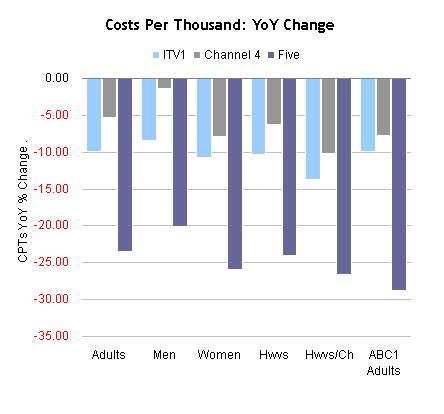
November saw Five’s CPT price fall across the board, with the smallest decline coming for the Men audience, down 20% year on year. The largest fall was for ABC1 Adults, down 28.8% year on year.
There were also across the board declines for ITV1 and Channel 4. The largest CPT price fall for both channels was in the Housewives with Children audience.
| CPTs | Adults | Men | Women | Hwvs | Hwvs/Ch | ABC1 Adults |
|---|---|---|---|---|---|---|
| ITV1 | 6.18 | 16.53 | 9.86 | 9.40 | 40.17 | 16.25 |
| % Ch YoY | -9.88 | -8.4 | -10.77 | -10.33 | -13.73 | -9.85 |
| Channel 4 | 7.90 | 19.82 | 13.14 | 12.07 | 53.54 | 18.45 |
| % Ch YoY | -5.26 | -1.4 | -7.8 | -6.2 | -10.1 | -7.7 |
| Five | 4.81 | 11.91 | 8.06 | 7.19 | 32.59 | 13.54 |
| % Ch YoY | -23.51 | -20.0 | -25.9 | -24.1 | -26.7 | -28.8 |
Commercial Impacts
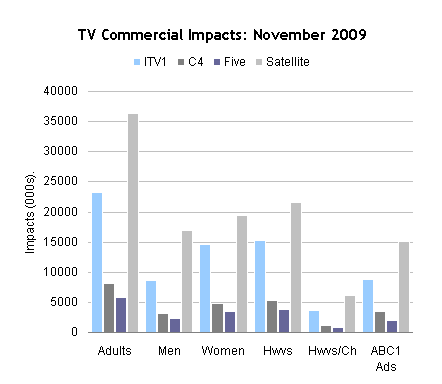
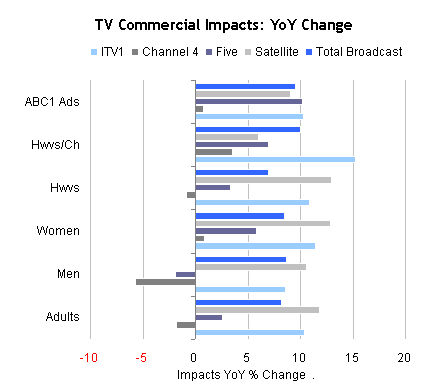
November was a good month for ITV1 in terms of commercial impacts, as the broadcaster recorded increases in all of our featured audiences. The largest increase was in the Housewives with Children category, up 15.3% year on year.
The X Factor continued to dominate the ratings in November, pulling in an average of 14.4 million viewers towards the end of the month.
Channel 4’s commercial impacts were up across three of our featured audiences, with the biggest rise also coming in the Housewives and Children category, up 3.5% year on year.
Five, meanwhile, was up across four of our featured audiences, with ABC1 Adults seeing a 10.2% year on year increase.
Total Broadcast commercial impacts were up across the board. The largest increase was for the Housewives with Children audience, up 10% year on year.
| Impacts | Adults | Men | Women | Hwvs | Hwvs/Ch | ABC1 Adults |
|---|---|---|---|---|---|---|
| ITV1 | 23,226 | 8,679 | 14,547 | 15,255 | 3,571 | 8,828 |
| % Ch YoY | 10.4 | 8.6 | 11.4 | 10.9 | 15.3 | 10.3 |
| C4 | 8,113 | 3,234 | 4,878 | 5,311 | 1,198 | 3,476 |
| % Ch YoY | -1.8 | -5.7 | 0.9 | -0.8 | 3.5 | 0.8 |
| Five | 5,745 | 2,319 | 3,426 | 3,841 | 847 | 2,040 |
| % Ch YoY | 2.6 | -1.9 | 5.8 | 3.3 | 7.0 | 10.2 |
| Satellite | 36,385 | 17,002 | 19,383 | 21,518 | 6,114 | 15,161 |
| % Ch YoY | 11.8 | 10.6 | 12.9 | 13.0 | 6.0 | 9.0 |
| Total Broadcast | 30,061 | 74,890 | 12,028 | 31,621 | 43,268 | 46,999 |
| % Ch YoY | 8.2 | 8.7 | 8.5 | 6.9 | 10.0 | 9.5 |