Multichannel television now reaches more than half of UK homes, according to the most recent figures from the Independent Television Commission (now incorporated into the communications regulator Ofcom).
The Q3 2003 report, released just before Christmas, shows that multichannel TV is now received by 51.2% of all homes, up from 49.8% in Q2. The penetration of digital television (DTV) rose from 45.5% to 47.1% quarter on quarter. The total number of digital television households grew by 3.7% (417,000) to reach 11.7 million homes.
The number of analogue cable homes continued to decline, falling by 4.0% to just over one million. The number of digital cable homes nudged up by 2.7% to 2.2 million. The total number of pay-TV households rose by 1.8% quarter on quarter to 10.0 million.
| UK TV Platform Subscriber Figures | |||
| Q2 2003 | Q3 2003 | Quarterly growth rate | |
| Pay TV | |||
| Analogue cable | 1,071,676 | 1,028,977 | -4.0% |
| Digital cable | 2,188,375 | 2,248,190 | 2.7% |
| Total cable | 3,260,051 | 3,277,167 | 0.5% |
| Digital DTH | 6,559,000 | 6,718,000 | 2.4% |
| ADSL | 10,686 | 10,037 | -6.1% |
| Total pay TV households | 9,829,737 | 10,005,204 | 1.8% |
| Free-to-air (FTA) | |||
| FTA DTT | 1,790,000 | 1,900,000 | 6.1% |
| FTA DTH* | 738,900 | 827,705 | 12.0% |
| Total FTA households | 2,528,900 | 2,727,705 | 7.9% |
| Total | |||
| Total UK multi-channel households | 12,358,637 | 12,732,909 | 3.0% |
| Total UK digital households | 11,286,961 | 11,703,932 | 3.7% |
| Multi-channel penetration | 49.8% | 51.2% | 1.4% points |
| Digital penetration | 45.5% | 47.1% | 1.6% points |
| Source: ITC, December 2003 | |||
Platforms
Shares of the multichannel TV market by platform are as shown.
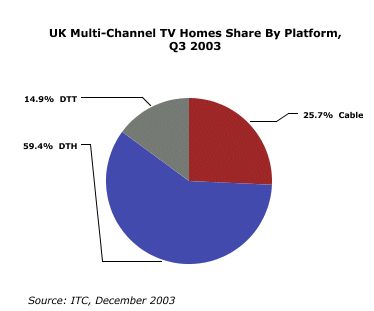
BSkyB’s strength in the sector continued, with its share of multichannel homes rising from 59.1% to 59.3% in Q3. It also increased its share of pay-television homes, to 67.1%, whilst its share of digital homes fell slightly to 64.5% as a result of the rapid growth of digital terrestrial platform, Freeview.
| DTH (BSkyB) | ||
| Q2 2003 | Q3 2003 | |
| TV homes connected* | 6,559,000 | 6,718,000 |
| ARPU | £366 | £366 |
| Churn | 9.4% | 9.6% |
| Base package price | £12.50 | £12.50 |
| * excludes Republic of Ireland | ||
| Source: ITC, December 2003 | ||
DTT broadcasts are received primarily via the Freeview platform, which now reaches 16.2% of all digital homes and 7.6% of all TV homes.
Based on the best estimates available Freeview added approximately 110,000 households during Q3, representing an increase of 6% on the previous quarter. Of these, the ITC estimates that 892,000 use new Freeview adapters, 408,000 use IDTV sets and the remaining 600,000 use former ITV Digital set-top boxes.
Set-top boxes have recently reduced in price and a number are now available for around £70, compared with £99 at launch. It has also been possible to obtain free-to-air digital decoders at lower prices.
| DTT Trends | ||
| Q2 2003 | Q3 2003 | |
| DTT homes | 1,790,000 | 1,900,000 |
| ITV Digital STB | 600,000 | 600,000 |
| Freeview adapters | 797,000 | 892,000 |
| IDTV sets | 393,000 | 408,000 |
| Source: ITC, December 2003 | ||
There were 3.3 million cable households in the UK by Q3 2003. Of these, 2.0 million subscribed to NTL and 1.3 million to Telewest Communications; the remainder took Omne Communications and Wightcable services.
Telewest subscribers showed an increase of 8,038 in the quarter, whilst NTL subscribers saw a decrease of 13,000. Overall, the Digital subscribers also continued to grow, reaching a combined total of 2.2 million by the end of the quarter â an increase of 2.7% from Q2 2003.
| Cable Trends | ||||
| NTL | Telewest | |||
| Q2 2003 | Q3 2003 | Q2 2003 | Q3 2003 | |
| Homes passed and marketed | 7,756,900 | 8,404,100 | 4,686,974 | 4,679,688 |
| Total residential subscribers | 2,753,300 | 2,809,500 | 1,719,868 | 1,721,550 |
| TV homes connected | 2,022,800 | 2,009,700 | 1,250,511 | 1,258,549 |
| Digital TV homes connected | 1,269,700 | 1,294,800 | 911,191 | 945,595 |
| TV penetration rate | 26.1% | 26.9% | 26.7% | 26.9% |
| ARPU | £492.48 | £497.16 | £512.64 | £527.16 |
| Churn rate | 12.9% | 14.4% | 20.5% | 16.9% |
| Basic package price | £18.00 | £18.00 | £13.50 | £13.50 |
| Source: ITC, December 2003 | ||||
The trends in multichannel TV and DTV penetration are shown in the table below.
| UK Pay-TV Trends, By Platform | ||||||
| Q2 2002 | Q3 2002 | Q4 2002 | Q1 2003 | Q2 2003 | Q3 2003 | |
| Multichannel penetration – % of TV households | ||||||
| Cable | 14.1 | 13.8 | 13.6 | 13.4 | 13.1 | 13.2 |
| DTH | 25.9 | 26.8 | 27.7 | 28.6 | 29.4 | 30.4 |
| DTT | 3.7 | 4.2 | 5.4 | 6.5 | 7.2 | 7.6 |
| ADSL | 0.1 | 0.1 | 0.1 | 0.1 | 0.0 | 0.0 |
| Total | 43.8 | 44.9 | 46.7 | 48.6 | 49.8 | 51.1 |
| Digital TV penetration – % of TV households | ||||||
| Cable | 8.3 | 8.3 | 8.5 | 8.7 | 8.8 | 9.0 |
| DTH | 25.9 | 26.8 | 27.7 | 28.6 | 29.4 | 30.4 |
| DTT | 3.7 | 4.2 | 5.4 | 6.5 | 7.2 | 7.6 |
| ADSL | 0.1 | 0.1 | 0.1 | 0.1 | 0.0 | 0.0 |
| Total | 38.0 | 39.4 | 41.6 | 43.9 | 45.5 | 47.1 |
| Share of digital homes by platform (%) | ||||||
| Cable | 21.8 | 21.1 | 20.4 | 19.8 | 19.4 | 19.2 |
| DTH | 68.2 | 68.1 | 66.6 | 65.3 | 64.7 | 64.5 |
| DTT | 9.8 | 10.6 | 12.9 | 14.8 | 15.9 | 16.2 |
| ADSL | 0.2 | 0.2 | 0.1 | 0.1 | 0.1 | 0.1 |
| Source: ITC, December 2003 | ||||||
Subscribers can access ten years of media news and analysis in the Archive