
The BBC retained its position over commercial radio in Q3 2005, with the latest set of RAJAR figures showing the Corporation holding on to its position as market leader across national stations.
However, local commercial stations outperformed the BBC in terms of share of listening and average hours per listener.
Share of Listening
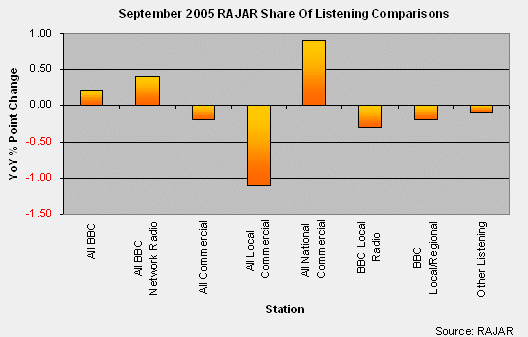
The UK’s national commercial radio stations saw the largest percentage increase in the third quarter of 2005, rising by 0.9% points year on year, reaching a total share of 10.5%, while all local commercial stations dampened the commercial sector’s success, dropping by 1.1% for the same period.
Local commercial radios decline resulted in an overall dip in share of listening for all commercial stations, with the sector going down by 0.2% points year on year.
The BBC pushed its overall share of listening up slightly by 0.2% points year on year with national stations adding 0.4% points in the same period.
The Corporation’s local radio and local/regional stations suffered blows, however, dropping by 0.3% and 0.2%. Despite this the BBC managed to retain its position as market leader, with a 54.6% share of listening across all BBC stations.
Other Listening saw a loss in share, dropping by 0.1% to command a share of 1.9%.
| September 2005 RAJAR Share Of Listening (%) Comparisons | ||||||
| Station | Ending Sep 04 | Ending Dec 04 | Ending Mar 05 | Ending Jun 05 | Ending Sep 05 | YoY % Point Change Sep 04 vs Sep 05 |
| All BBC | 54.40 | 54.00 | 54.20 | 54.00 | 54.60 | 0.20 |
| All BBC Network Radio | 43.50 | 43.00 | 43.40 | 43.10 | 43.90 | 0.40 |
| All Commercial | 43.70 | 44.20 | 43.80 | 44.00 | 43.50 | -0.20 |
| All Local Commercial | 34.10 | 34.20 | 33.60 | 33.80 | 33.00 | -1.10 |
| All National Commercial | 9.60 | 10.00 | 10.20 | 10.20 | 10.50 | 0.90 |
| BBC Local Radio | 10.50 | 10.80 | 10.60 | 10.50 | 10.20 | -0.30 |
| BBC Local/Regional | 10.90 | 11.00 | 10.80 | 10.90 | 10.70 | -0.20 |
| Other Listening | 2.00 | 1.80 | 2.00 | 2.00 | 1.90 | -0.10 |
Weekly Reach
The BBC led the way in terms of weekly reach during Q3, with its total of 32.9 million listeners outperforming commercial competitors.
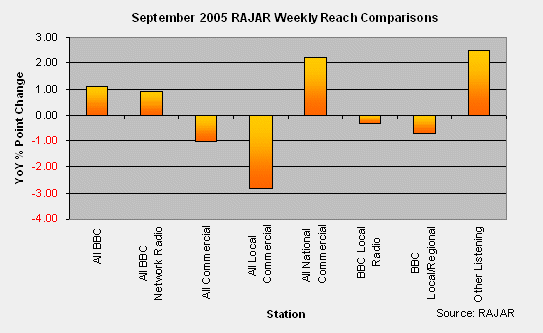
The BBC’s national stations performed well, enjoying an increase of 0.89% year on year. The Corporation did suffer some decline however, with its local/regional stations dipping by 0.73% year on year, mirroring the performance of BBC local radio which saw weekly reach fall by 0.32% to 7.58 million.
National commercial stations managed to push their weekly reach up by 2.22% year on year, while all local commercial offerings dipped by 2.81% compared to the same period last year. Overall, the commercial radio sector lost 1.02% in weekly reach year on year in Q3.
Other Listening stations pushed its weekly reach up by 2.48% year on year.
| September 2005 RAJAR Weekly Reach (000s) Comparisons | ||||||
| Station | Ending Sep 04 | Ending Dec 04 | Ending Mar 05 | Ending Jun 05 | Ending Sep 05 | YoY % Change Sep 04 vs Sep 05 |
| All BBC | 32,514 | 32,490 | 32,543 | 32,885 | 32,873 | 1.10 |
| All BBC Network Radio | 28,643 | 28,429 | 28,614 | 28,783 | 28,898 | 0.89 |
| All Commercial | 31,038 | 31,176 | 30,977 | 31,199 | 30,722 | -1.02 |
| All Local Commercial | 25,719 | 25,395 | 25,424 | 25,522 | 24,996 | -2.81 |
| All National Commercial | 12,752 | 13,007 | 12,987 | 12,950 | 13,035 | 2.22 |
| BBC Local Radio | 7,604 | 7,899 | 7,880 | 7,747 | 7,580 | -0.32 |
| BBC Local/Regional | 9,928 | 10,243 | 10,191 | 10,077 | 9,856 | -0.73 |
| Other Listening | 2,704 | 2,565 | 2,879 | 2,690 | 2,771 | 2.48 |
Average Hours Per Listener
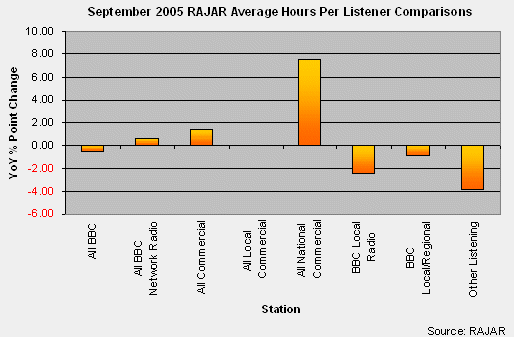
The BBC managed to stay ahead of the competition in average hours per listener during Q3, despite suffering a heavy decline in its local radio division, with a drop of 2.5% year on year.
This poor performance was mirrored in the Corporation’s average hours per listener across all BBC, with a dip of 0.56%, compacted by a decline of 0.85% year on year in BBC local/regional stations.
BBC network radio managed to buck the trend, however, increasing by 0.62% in the third quarter.
National commercial radio faired much better in average hours per listener, with the sector pushing up by 7.5%.
Overall, all commercial radio stations rose by 1.33% year on year, despite local commercial remaining flat in average hours per listener.
Other listening followed the BBC’s lead, dropping by 3.85% year on year.
| September 2005 RAJAR Average Hours Per Listener Comparisons | ||||||
| Station | Ending Sep 04 | Ending Dec 04 | Ending Mar 05 | Ending Jun 05 | Ending Sep 05 | YoY % Change Sep 04 vs Sep 05 |
| All BBC | 17.90 | 17.50 | 17.60 | 17.50 | 17.80 | -0.56 |
| All BBC Network Radio | 16.20 | 15.90 | 16.10 | 16.00 | 16.30 | 0.62 |
| All Commercial | 15.00 | 14.90 | 15.00 | 15.10 | 15.20 | 1.33 |
| All Local Commercial | 14.20 | 14.20 | 14.00 | 14.20 | 14.20 | 0.00 |
| All National Commercial | 8.00 | 8.10 | 8.30 | 8.40 | 8.60 | 7.50 |
| BBC Local Radio | 12.00 | 11.60 | 11.60 | 11.80 | 11.70 | -2.50 |
| BBC Local/Regional | 11.70 | 11.30 | 11.20 | 11.60 | 11.60 | -0.85 |
| Other Listening | 7.80 | 7.40 | 7.30 | 7.90 | 7.50 | -3.85 |
RAJAR: 0207 903 5350 www.rajar.co.uk