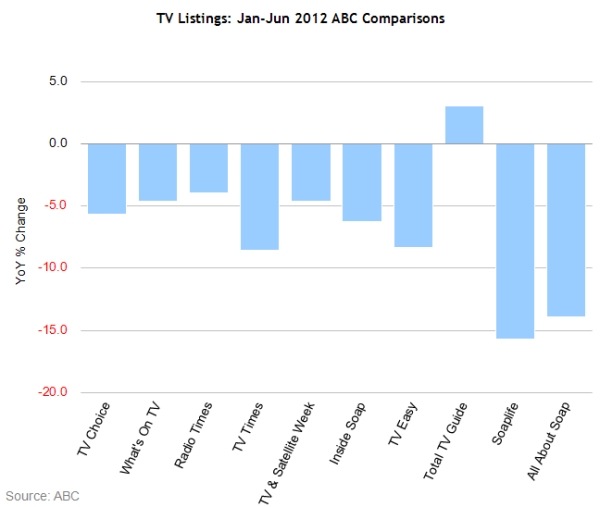
Overall the TV Listings market is down 5.4% YoY, with only one title showing a YoY increase (Total TV Guide – up 3.1%).
During the six-month period, the market is down 3.8%, again with just one title on the ascendancy – Soaplife, up 3.2%.
The top two titles in the market, TV Choice and What’s on TV, had a difficult period, losing 135,337 copies between them.
| Title | Publishing Co | Jan-Jun 11 | Jan-Jun 12 | Actual Change | YoY % Ch | Jul-Dec 11 | PoP % Ch |
|---|---|---|---|---|---|---|---|
| TV Choice | H Bauer Publishing | 1,354,761 | 1,277,850 | -76,911 | -5.7 | 1,304,382 | -2.0 |
| What’s On TV | IPC Media Ltd | 1,274,035 | 1,215,609 | -58,426 | -4.6 | 1,253,697 | -3.0 |
| Radio Times | Immediate Media Company | 901,036 | 865,562 | -35,474 | -3.9 | 925,373 | -6.5 |
| TV Times | IPC Media Ltd | 290,303 | 265,550 | -24,753 | -8.5 | 294,765 | -9.9 |
| TV & Satellite Week | IPC Media Ltd | 176,837 | 168,630 | -8,207 | -4.6 | 173,474 | -2.8 |
| Inside Soap | Hearst Magazines UK | 165,022 | 154,657 | -10,365 | -6.3 | 157,413 | -1.8 |
| TV Easy | IPC Media Ltd | 162,145 | 148,664 | -13,481 | -8.3 | 150,405 | -1.2 |
| Total TV Guide | H Bauer Publishing | 117,448 | 121,052 | 3,604 | 3.1 | 122,927 | -1.5 |
| Soaplife | IPC Media Ltd | 100,798 | 84,964 | -15,834 | -15.7 | 82,315 | 3.2 |
| All About Soap | Hearst Magazines UK | 90,861 | 78,244 | -12,617 | -13.9 | 87,156 | -10.2 |
| Total | 4,633,246 | 4,380,782 | 252,464 | -5.4 | 4,551,907 | -3.8 |
Source: ABC
MediaTel subscribers can get quick access to all the latest circulation figures in our ABC Circulation: Consumer Magazines report.