Revenues
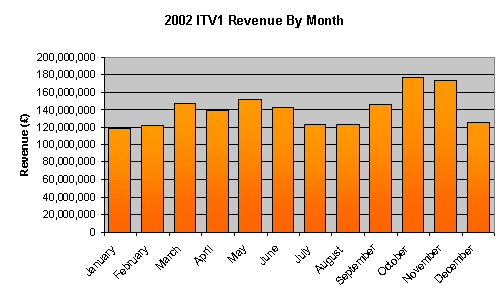
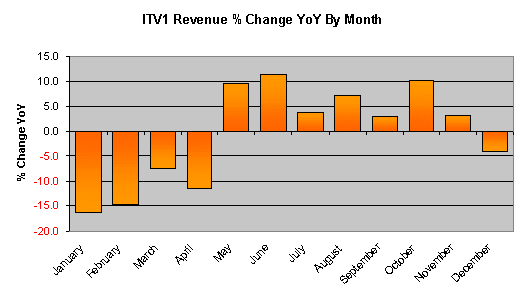
The ongoing advertising downturn continued to take its toll on ITV1 during 2002, with revenue falling by 0.8% year on year to below £170 billion. The heavy losses experienced during 2001 continued well into 2002. However, increased bookings for the World Cup boosted revenue from May onwards, with June seeing an 11.3% year on year increase. The year ended on a less than positive note for the channel, with revenue slipping by 4% during December.
| 2002 ITV1 Revenues | |||
| Month | Revenue (£) 2001 | Revenue (£) 2002 | % Change |
| January | 140,920,000 | 118,060,000 | -16.2 |
| February | 143,030,000 | 121,950,000 | -14.7 |
| March | 159,700,000 | 147,650,000 | -7.5 |
| April | 156,530,000 | 138,550,000 | -11.5 |
| May | 138,600,000 | 151,680,000 | 9.4 |
| June | 128,210,000 | 142,760,000 | 11.3 |
| July | 117,940,000 | 122,360,000 | 3.7 |
| August | 115,090,000 | 123,256,000 | 7.1 |
| September | 142,340,000 | 146,340,000 | 2.8 |
| October | 160,190,000 | 176,400,000 | 10.1 |
| November | 168,270,000 | 173,550,000 | 3.1 |
| December | 129,780,000 | 124,650,000 | -4.0 |
| Total | 1,700,600,000 | 1,687,206,000 | -0.8 |
| Source: Agency Estimates | |||
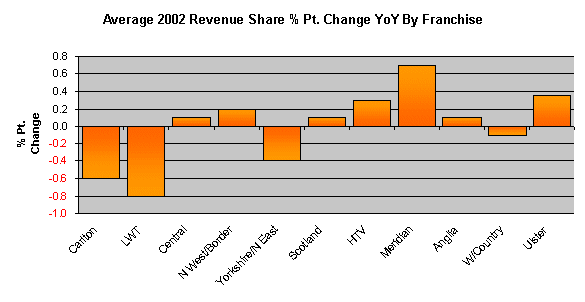
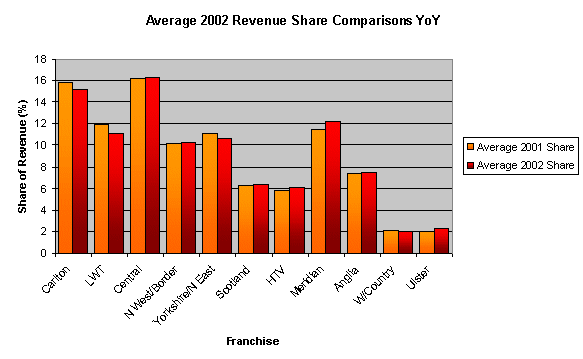
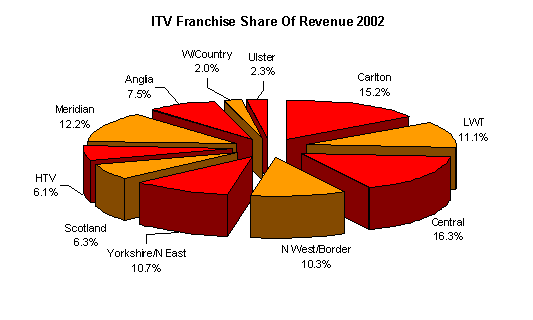
In an analysis of the ITV franchise companies, Meridian saw the biggest increase in revenue share during 2002, with a 0.7% point increase to 12.2%. Carlton, which saw the biggest increase in revenue share during 2001, witnessed a 0.6% point decline during 2002. Central continued to command the largest share of total ITV revenue for the year, adding 0.1% points to 16.3%.
| Average 2002 Share Of Revenue By ITV Franchise | |||
| Franchise | Average 2001 Share | Average 2002 Share | % Point Change |
| Carlton | 15.8 | 15.2 | -0.6 |
| LWT | 11.9 | 11.1 | -0.8 |
| Central | 16.2 | 16.3 | 0.1 |
| N West/Border | 10.1 | 10.3 | 0.2 |
| Yorkshire/N East | 11.1 | 10.7 | -0.4 |
| Scotland | 6.2 | 6.3 | 0.1 |
| HTV | 5.8 | 6.1 | 0.3 |
| Meridian | 11.5 | 12.2 | 0.7 |
| Anglia | 7.4 | 7.5 | 0.1 |
| W/Country | 2.1 | 2.0 | -0.1 |
| Ulster | 2.0 | 2.3 | 0.4 |
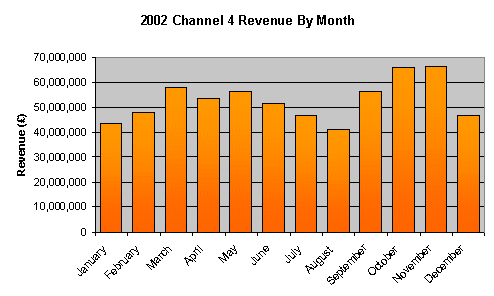
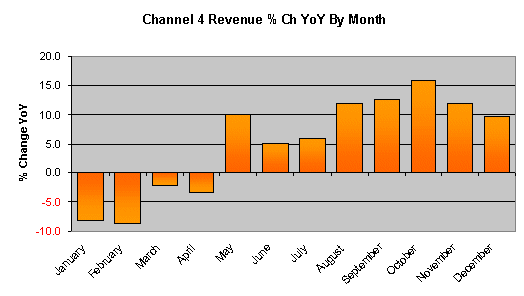
Channel 4 got off to a bad start during 2002 as the annus horribilis that was the 2001 proved hard to shake. After four consecutive months of losses, revenue picked up in May and continued strongly throughout the rest of the year. The most notable increase occurred in October, when revenue was up by 15.8% year on year. Overall, revenue at the channel increased by 4.9% during 2002 to £633,520,000
| 2002 Channel 4 Revenues | |||
| Month | Revenue (£) 2001 | Revenue (£) 2002 | % Change |
| January | 47,500,000 | 43,600,000 | -8.2 |
| February | 52,100,000 | 47,600,000 | -8.6 |
| March | 59,070,000 | 57,780,000 | -2.2 |
| April | 55,630,000 | 53,770,000 | -3.3 |
| May | 51,200,000 | 56,330,000 | 10.0 |
| June | 49,250,000 | 51,770,000 | 5.1 |
| July | 43,880,000 | 46,500,000 | 6.0 |
| August | 36,830,000 | 41,230,000 | 11.9 |
| September | 49,840,000 | 56,170,000 | 12.7 |
| October | 56,830,000 | 65,830,000 | 15.8 |
| November | 59,150,000 | 66,270,000 | 12.0 |
| December | 42,600,000 | 46,670,000 | 9.6 |
| Total | 603,880,000 | 633,520,000 | 4.9 |
| Source: Agency Estimates | |||
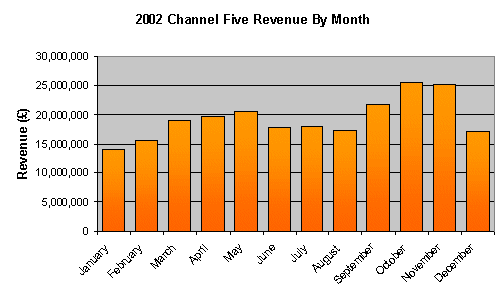
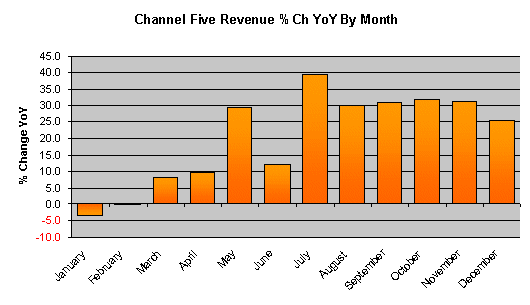
Channel Five erased the lacklustre performance of the previous year with a bumper 2002, which saw revenue increase by 20.3% year on year. July was the most lucrative month for the fledgling channel, with revenue up by almost 40% on the same period the previous year. Changes to its programming strategy and a full-scale rebrand (see Channel 5 Relaunched As Five) ensured that the channel finished the year on a positive note, with revenue up by 25.5% during December.
| 2002 Channel Five Revenues | |||
| Month | Revenue (£) 2001 | Revenue (£) 2002 | % Change |
| January | 14,630,000 | 14,130,000 | -3.4 |
| February | 15,650,000 | 15,640,000 | -0.1 |
| March | 17,600,000 | 19,020,000 | 8.1 |
| April | 17,900,000 | 19,630,000 | 9.7 |
| May | 15,820,000 | 20,470,000 | 29.4 |
| June | 15,820,000 | 17,730,000 | 12.1 |
| July | 12,880,000 | 17,950,000 | 39.4 |
| August | 13,330,000 | 17,333,000 | 30.0 |
| September | 16,600,000 | 21,770,000 | 31.1 |
| October | 19,270,000 | 25,400,000 | 31.8 |
| November | 19,130,000 | 25,100,000 | 31.2 |
| December | 13,570,000 | 17,030,000 | 25.5 |
| Total | 192,200,000 | 231,203,000 | 20.3 |
| Source: Agency Estimates | |||
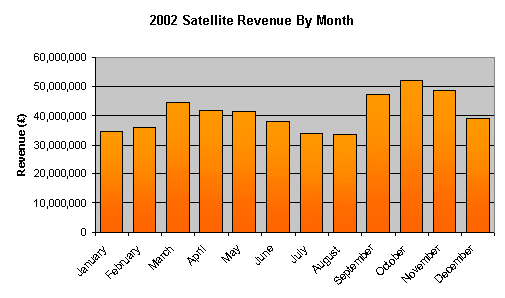
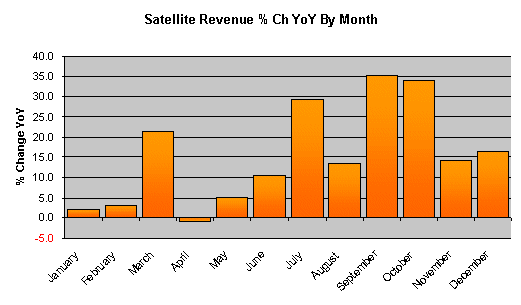
After a strong 2001, Cable & Satellite revenues continued to improve during 2002, increasing by 14.8% year on year to 490 million. April was the only month to show a loss, although the second half of the year was notably better than the first half, with revenue rising by more than 30% during September and October. Revenue was up by 16.5% during December when the number of people watching cable, satellite and digital terrestrial TV channels outnumbered those watching ITV1 during the Christmas week (see Multichannel Broadcasters Overtake ITV1 At Christmas).
| 2002 Satellite Revenues | |||
| Month | Revenue 2001 (£) | Revenue 2002 (£) | % Change |
| January | 33,830,000 | 34,480,000 | 1.9 |
| February | 34,850,000 | 35,870,000 | 2.9 |
| March | 36,800,000 | 44,640,000 | 21.3 |
| April | 41,900,000 | 41,490,000 | -1.0 |
| May | 39,200,000 | 41,200,000 | 5.1 |
| June | 34,400,000 | 38,000,000 | 10.5 |
| July | 26,200,000 | 33,900,000 | 29.4 |
| August | 29,490,000 | 33,433,000 | 13.4 |
| September | 35,100,000 | 47,420,000 | 35.1 |
| October | 38,900,000 | 52,090,000 | 33.9 |
| November | 42,620,000 | 48,600,000 | 14.0 |
| December | 33,520,000 | 39,050,000 | 16.5 |
| Total | 426,810,000 | 490,173,000 | 14.8 |
| Source: Agency Estimates | |||
Costs Per Thousand
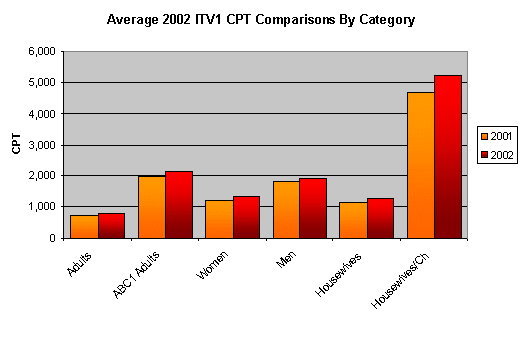
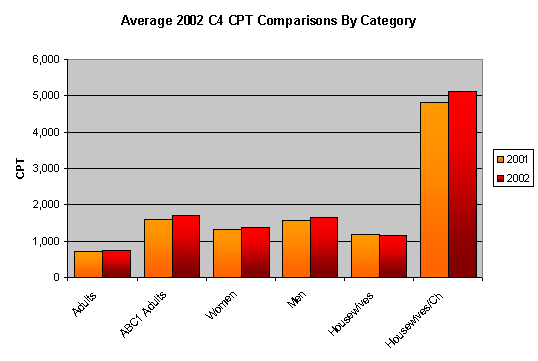
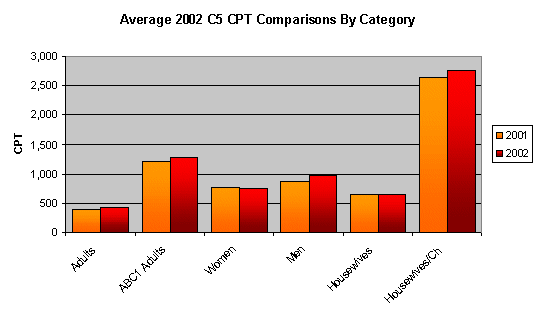
Costs per thousand rose across all categories and all channels on average during 2002, with the exception of Channel 4’s Housewives category, which fell by 3.3%. In a marked contrast to the previous year, some of the most significant rises were seen at ITV1, where the Housewives With Children increased by 11.3% and at Channel Five, where the Men category rose by 12%.
| Average ITV1 CPT | |||
| Category | Average CPT 2001 (p) | Average CPT 2002 (p) | % Change |
| Adults | 725.2 | 783.4 | 8.0 |
| ABC1 Adults | 1,971.0 | 2,140.7 | 8.6 |
| Women | 1,202.0 | 1,318.8 | 9.7 |
| Men | 1,830.0 | 1,931.0 | 5.5 |
| Housewives | 1,127.0 | 1,244.2 | 10.4 |
| Housewives/Ch | 4,684.0 | 5,214.8 | 11.3 |
| Average C4 CPT | |||
| Category | Average CPT 2001 (p) | Average CPT 2002 (p) | % Change |
| Adults | 720.3 | 751.0 | 4.3 |
| ABC1 Adults | 1,616.0 | 1,724.9 | 6.7 |
| Women | 1,320.3 | 1,370.8 | 3.8 |
| Men | 1,588.3 | 1,661.4 | 4.6 |
| Housewives | 1,190.0 | 1,150.2 | -3.3 |
| Housewives/Ch | 4,788.0 | 5,110.5 | 6.7 |
| Average C5 CPT | |||
| Category | Average CPT 2001 (p) | Average CPT 2002 (p) | % Change |
| Adults | 404.3 | 424.8 | 5.1 |
| ABC1 Adults | 1,207.0 | 1,276.6 | 5.8 |
| Women | 757.3 | 753.3 | -0.5 |
| Men | 869.3 | 973.4 | 12.0 |
| Housewives | 640.0 | 652.8 | 2.0 |
| Housewives/Ch | 2,633.0 | 2,754.3 | 4.6 |
Commercial Impacts
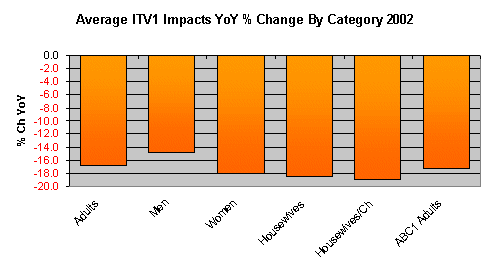
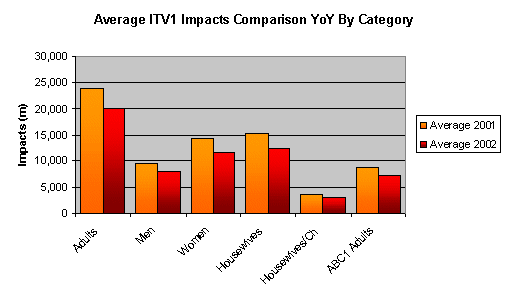
Commercial impacts on ITV1 were down across all audience categories on average during 2002. For the second consecutive year the largest fall was seen in the Housewives With Children category, which was down by 18.9%.
| Average ITV Impacts | ||||||
| Adults | Men | Women | Housewives | Housewives/Ch | ABC1 Adults | |
| Average 2001 | 23,869 | 9,479 | 14,391 | 15,342 | 3,694 | 8,801 |
| Average 2002 | 19,859 | 8,078 | 11,781 | 12,496 | 2,996 | 7,271 |
| % Ch YoY | -16.8 | -14.8 | -18.1 | -18.5 | -18.9 | -17.4 |
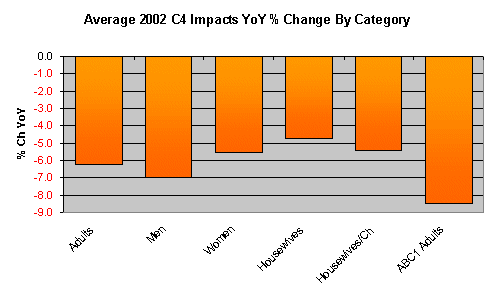
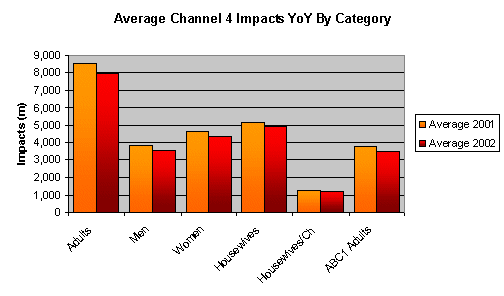
The story was the same for Channel 4, which saw the most significant year on year reductions in its ABC1 Adults category and its Men category, which were down by 8.5% and 7% respectively during 2002.
| Average C4 Impacts | ||||||
| Adults | Men | Women | Housewives | Housewives/Ch | ABC1 Adults | |
| Average 2001 | 8,481 | 3,853 | 4,628 | 5,135 | 1,286 | 3,784 |
| Average 2002 | 7,954 | 3,584 | 4,370 | 4,892 | 1,217 | 3,462 |
| % Ch YoY | -6.2 | -7.0 | -5.6 | -4.7 | -5.4 | -8.5 |
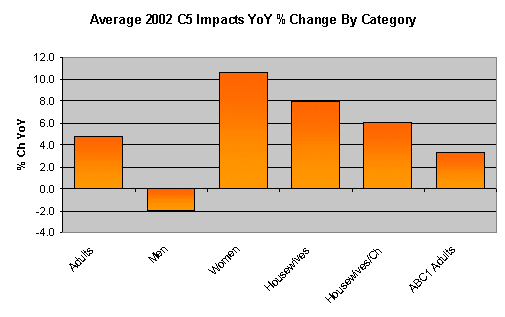
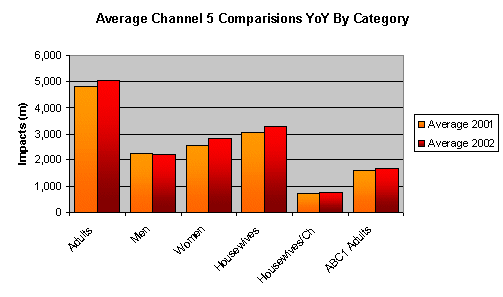
Channel Five saw commercial impacts increase across all audience categories in 2002. The most significant increase was a 7.9% rise in the Women category.
| Average C5 Impacts | ||||||
| Adults | Men | Women | Housewives | Housewives/Ch | ABC1 Adults | |
| Average 2001 | 4,809 | 2,238 | 2,571 | 3,043 | 738 | 1,617 |
| Average 2002 | 5,038 | 2,194 | 2,844 | 3,283 | 782 | 1,670 |
| % Ch YoY | 4.8 | -2.0 | 10.6 | 7.9 | 6.0 | 3.3 |
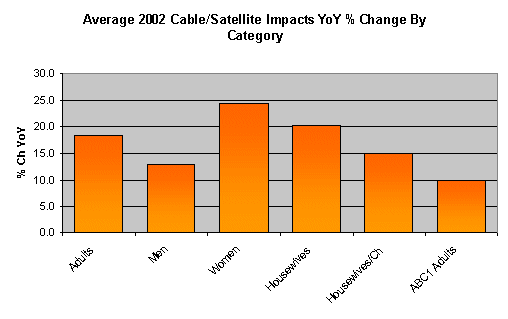
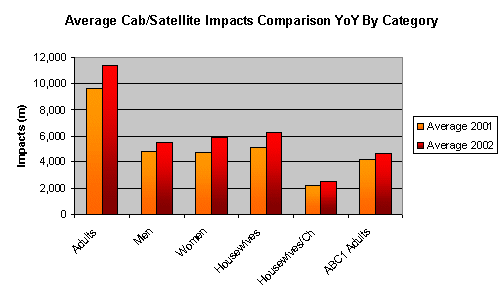
Cable & Satellite continued to see commercial impacts increase by the most significant amounts during 2002. These included a 24.3% jump in the Women category and a 20.3% rise in the Housewives category.
| Average Cable/Satellite Impacts | ||||||
| Adults | Men | Women | Housewives | Housewives/Ch | ABC1 Adults | |
| Average 2001 | 9,630 | 4,882 | 4,748 | 5,174 | 2,211 | 4,189 |
| Average 2002 | 11,409 | 5,509 | 5,901 | 6,224 | 2,541 | 4,604 |
| % Ch YoY | 18.5 | 12.8 | 24.3 | 20.3 | 14.9 | 9.9 |
A summary of the Key events in the Television media during 2002 is available by clicking End Of Year News Round-Up: Television.
Subscribers can access the Television database by selecting “Television” from the drop-down box at the top of this page.