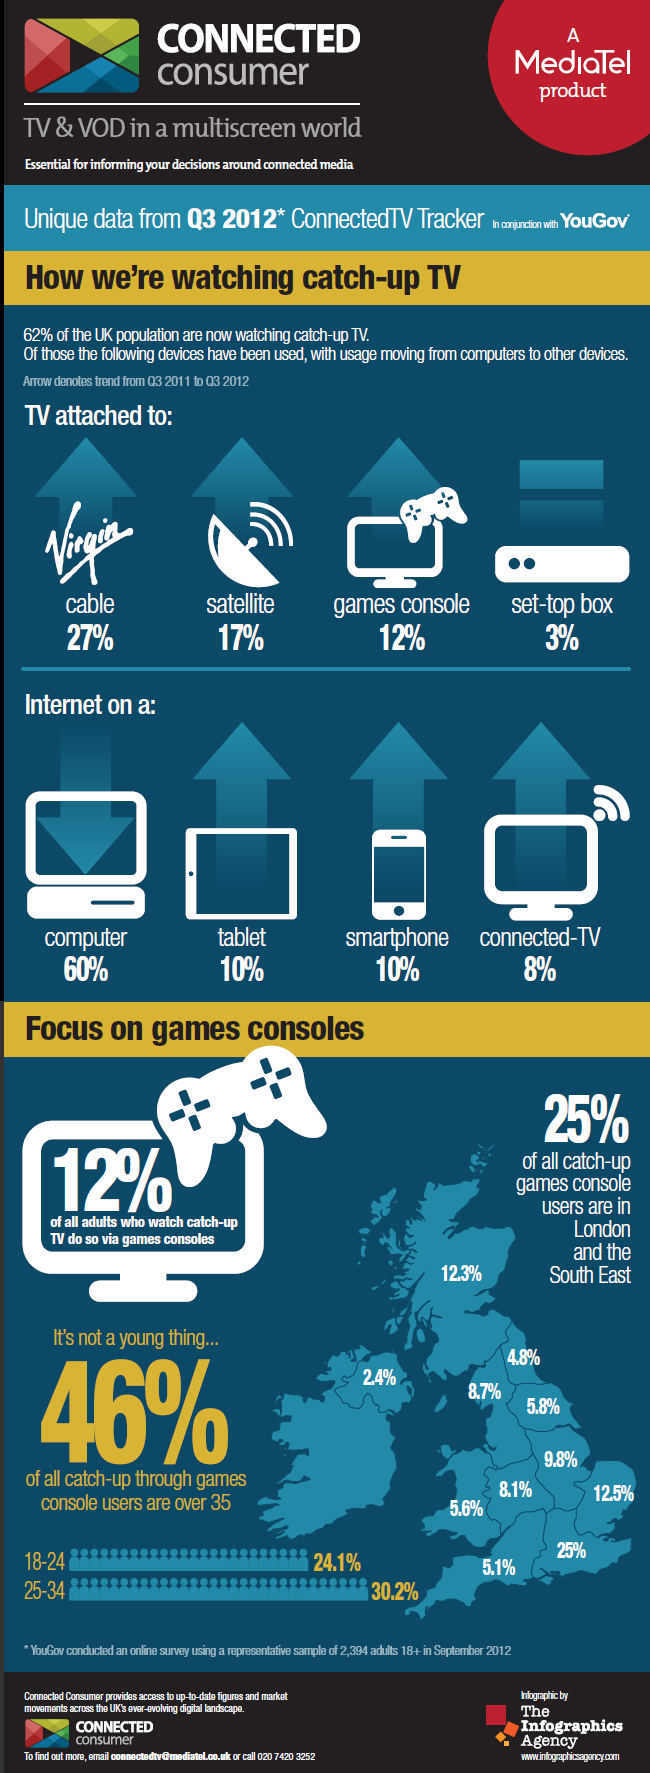
Infographic: How we’re watching catch-up TV

By

1 minute

The following infographic demonstrates how the UK population is now watching catch-up TV across the different platform options, using data from the latest quarter of MediaTel’s Connected TV Tracker survey, in association with YouGov. The infographic, created by The Infographics Agency, shows that the majority of catch-up TV viewing in the UK is still via…

Niall Johnson Avatar

Niall Johnson Niall reports on TV and online data, meaning he knows what people are looking at on the web, is aware of how many devices you can watch Countryfile on and writes the TV Overnights each morning. From Dublin, Niall has a keen interest in convergent technologies and the general confusion around the changing living room experience.


The following infographic demonstrates how the UK population is now watching catch-up TV across the different platform options, using data from the latest quarter of MediaTel’s Connected TV Tracker survey, in association with YouGov.

The infographic, created by The Infographics Agency, shows that the majority of catch-up TV viewing in the UK is still via the computer, at 60%, but the year on year trend for this platform is declining, with all other platforms increasing their percentage share.

All data that was used to create this infographic is available within the Consumption section of MediaTel Group’s new Connected Consumer product.
For more information on the product please contact the Connected Consumer team.



Want to get involved in the discussion?