The percentage of homes receiving any kind of multichannel TV – analogue or digital – rose from 48.6% to 49.8% quarter on quarter, in the three months to 30 June 2003.
Digital television (DTV) is also very close to the 50% penetration mark, now reaching 45.5% of the country’s homes, up from 43.9% in the first quarter. This is 11.3 million digital TV households. A recent report from Continental Research also noted that DTV has surpassed the 10 million home mark in the UK.
There were over 325,000 net new multichannel homes added in the period, with digital adding over 423,000, but analogue cable homes declining by 8.4%, from 1.2 million homes in Q1 2003 to 1.1 million homes in Q2. The number of homes receiving TV via ADSL services also fell, by 4.8% to 10,686.
| UK TV Platform Subscriber Figures | |||
| Q1 2003 | Q2 2003 | Quarterly growth rate | |
| Pay TV | |||
| Analogue cable | 1,169,665 | 1,071,676 | -8.4% |
| Digital cable | 2,149,802 | 2,188,375 | 1.8% |
| Total cable | 3,319,467 | 3,260,051 | -1.1% |
| Digital DTH | 6,433,000 | 6,559,000 | 2.0% |
| ADSL | 11,228 | 10,686 | -4.8% |
| Total pay TV households | 9,763,695 | 9,829,737 | 0.7% |
| Free-to-air (FTA) | |||
| FTA DTT | 1,610,000 | 1,790,000 | 11.2% |
| FTA DTH* | 659,170 | 738,900 | 12.1% |
| Total FTA households | 2,269,170 | 2,528,900 | 11.4% |
| Total | |||
| Total UK multi-channel households | 12,032,865 | 12,358,637 | 2.7% |
| Total UK digital households | 10,863,200 | 11,286,961 | 3.9% |
| Multi-channel penetration | 48.6% | 49.8% | 1.2% points |
| Digital penetration | 43.9% | 45.5% | 1.6% points |
| Source: ITC, September 2003 | |||
Platforms Shares of the multichannel TV market by platform are as shown.

Sky continued its consistent growth, adding 126,000 paying subscribers over the quarter. Republic of Ireland subscribers stood at 286,000 by the end of the quarter, bringing the total number of Sky subscribers to 6.8 million.
The ITC also estimates that there are 738,900 Sky Digital subscribers (or ex-subscribers) who use their set-top boxes to receive only free-to-air services.
Annualised average revenue per user (ARPU) increased by £2 over the quarter to £366; Sky aims to achieve ARPU of £400 by 2005. Churn remained fairly constant at 9.4%. Sky’s churn has now remained below 10% for four consecutive quarters.
| DTH (BSkyB) | ||
| Q1 2003 | Q2 2003 | |
| TV homes connected* | 6,433,000 | 6,559,000 |
| ARPU | £364 | £366 |
| Churn | 9.3% | 9.4% |
| Base package price | £12.50 | £12.50 |
| * excludes Republic of Ireland | ||
| Source: ITC, September 2003 | ||
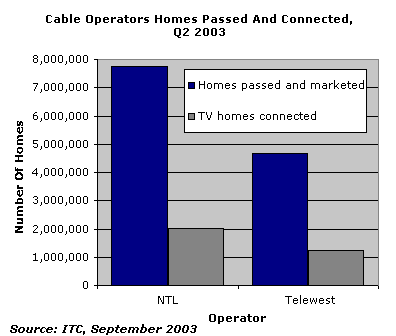
The total number of UK cable households stood a 3.3 million as of Q2 2003. Of these, 2.0 million subscribed to Ntl and 1.3 to Telewest, with smaller cable operators picking up the remainder. Ntl’s subscribers decreased by 51,178 and Telewest’s by 23,034 quarter on quarter.
Overall, the industry saw a drop in total subscribers of 59,416, to 3.3 million, representing a decline of 2% from Q1 2003. However, digital subscribers continued to grow, reaching 2.2 million by the end of Q2 2003.
NTL’s churn rate (for TV, telephony and the internet) fell for the sixth successive quarter, from 13.0% in Q1 2003 to 12.9% in Q2. Telewest reduced its churn rates for cable TV from 21.8% to 20.5%, following three quarters of increase.
Both companies reported an increase in ARPU, with Telewest’s up £501.96 in Q1 to £512.64, whilst NTL’s increased from £487.80 to £492.48.
| Cable Trends | ||||
| Ntl | Telewest | |||
| Q1 2003 | Q2 2003 | Q1 2003 | Q2 2003 | |
| Homes passed and marketed | 7,749,700 | 7,756,900 | 4,690,343 | 4,686,974 |
| Total residential subscribers | 2,713,500 | 2,753,300 | 1,743,722 | 1,719,868 |
| TV homes connected | 2,037,700 | 2,022,800 | 1,273,545 | 1,250,511 |
| Digital TV homes connected | 1,255,200 | 1,269,700 | 887,306 | 911,191 |
| TV penetration rate | 26.3% | 26.1% | 27.2% | 26.7% |
| ARPU | £487.80 | £492.48 | £501.96 | £512.64 |
| Churn rate | 13.0% | 12.9% | 21.8% | 20.5% |
| Basic package price | £18.00 | £18.00 | £18.50 | £13.50 |
| Source: ITC, September 2003 | ||||
Free-to-air digital terrestrial service, Freeview, continued to see the strongest growth, with the number of users jumping by 180,000 to 1.8 million in Q2.
| DTT Trends | ||
| Q1 2003 | Q2 2003 | |
| DTT homes | 1,610,000 | 1,790,000 |
| ITV Digital STB | 600,000 | 600,000 |
| Freeview adapters | 658,000 | 797,000 |
| iDTV sets | 352,000 | 393,000 |
| Source: ITC, September 2003 | ||
The trends in multichannel TV and DTV penetration are shown in the table below.
| UK Pay-TV Trends, By Platform | ||||||
| Q1 2002 | Q2 2002 | Q3 2002 | Q4 2002 | Q1 2003 | Q2 2003 | |
| Multichannel penetration – % of TV households | ||||||
| Cable | 14.5 | 14.1 | 13.8 | 13.6 | 13.4 | 13.1 |
| DTH | 25.0 | 25.9 | 26.8 | 27.7 | 28.6 | 29.4 |
| DTT | 5.2 | 3.7 | 4.2 | 5.4 | 6.5 | 7.2 |
| ADSL | 0.1 | 0.1 | 0.1 | 0.1 | 0.1 | 0.0 |
| Total | 44.7 | 43.8 | 44.9 | 46.7 | 48.6 | 49.8 |
| Digital TV penetration – % of TV households | ||||||
| Cable | 8.3 | 8.3 | 8.3 | 8.5 | 8.7 | 8.8 |
| DTH | 25.0 | 25.9 | 26.8 | 27.7 | 28.6 | 29.4 |
| DTT | 5.2 | 3.7 | 4.2 | 5.4 | 6.5 | 7.2 |
| ADSL | 0.1 | 0.1 | 0.1 | 0.1 | 0.1 | 0.0 |
| Total | 38.5 | 38.0 | 39.4 | 41.6 | 43.9 | 45.5 |
| Share of digital homes by platform (%) | ||||||
| Cable | 21.5 | 21.8 | 21.1 | 20.4 | 19.8 | 19.4 |
| DTH | 64.8 | 68.2 | 68.1 | 66.6 | 65.3 | 64.7 |
| DTT | 13.4 | 9.8 | 10.6 | 12.9 | 14.8 | 15.9 |
| ADSL | 0.2 | 0.2 | 0.2 | 0.1 | 0.1 | 0.1 |
| Source: ITC, September 2003 | ||||||
Subscribers to MediaTel Insight can access more national and international media analysis, forecasts and news by visiting the site.