
The post-festive period has seen solid returns for commercial television channels, with the entire market recording yearly increases in revenue in January.
Total Satellite was up 13.1% on December, while Channel 4, which saw only a slight increase in December, reported a lift of almost 30% to secure over £42 million – almost £10 million more than January 2013.
Meanwhile, Channel Five – which is likely to go up for sale this year – saw an 11.2% increase to take £24.3 million.
Both ITV and ITV Breakfast were up 6.6% to secure £109.9 million and £4.5 million, respectively.
Total Terrestrial was up almost 12% overall and recorded total revenues of almost £181 million.
Note – this article was updated in January 2015; the original incorrectly said Total Satellite had increased revenue by 40%.
Network Revenue
| Total Revenue | Jan 13 | Jan 14 | % Change |
|---|---|---|---|
| ITV1 | 103,140,000 | 109,980,000 | 6.6 |
| Channel 4 | 32,450,000 | 42,020,000 | 29.5 |
| Channel 5 | 21,860,000 | 24,300,000 | 11.2 |
| ITV Breakfast | 4,270,000 | 4,550,000 | 6.6 |
| Total Terrestrial (inc. ITV Breakfast) | 161,720,000 | 180,850,000 | 11.8 |
| Total Satellite | 119,080,000 | 134,620,000 | 13.1 |
Source: Agency Estimates
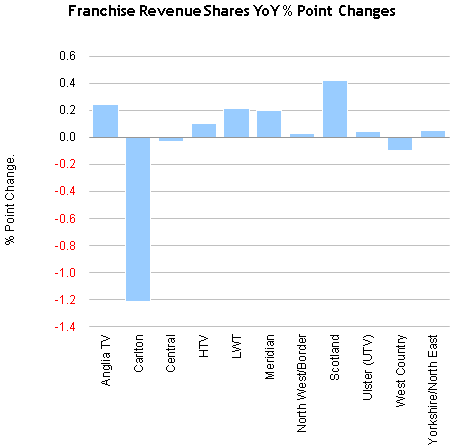
ITV Franchise Area
| % Share of ITV Revenue by Franchise | Jan 13 | Jan 14 | % Point Change |
|---|---|---|---|
| Anglia TV | 7.73 | 7.97 | 0.24 |
| Carlton | 14.21 | 13.00 | -1.21 |
| Central | 15.58 | 15.55 | -0.03 |
| HTV | 6.24 | 6.34 | 0.10 |
| LWT | 11.90 | 12.11 | 0.21 |
| Meridian | 11.58 | 11.78 | 0.20 |
| North West/Border | 10.55 | 10.58 | 0.03 |
| Scotland | 6.97 | 7.39 | 0.42 |
| Ulster (UTV) | 2.34 | 2.38 | 0.04 |
| West Country | 2.03 | 1.93 | -0.10 |
| Yorkshire/North East | 10.89 | 10.94 | 0.05 |
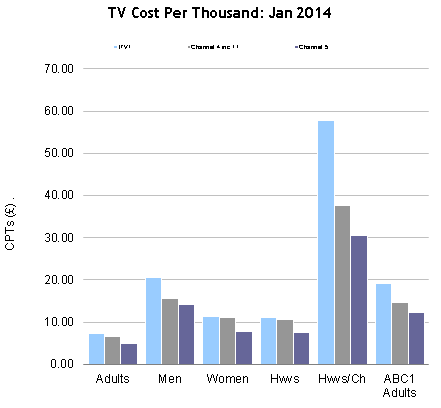
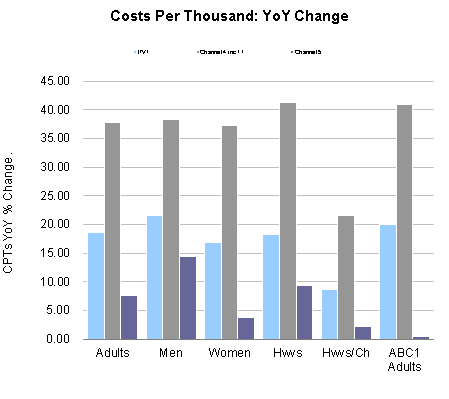
Network CPTs
| CPTs | Adults | Men | Women | Hwvs | Hwvs/Ch | ABC1 Adults |
|---|---|---|---|---|---|---|
| ITV1 | 7.30 | 20.53 | 11.32 | 11.02 | 57.80 | 19.22 |
| % Ch YoY | 18.50 | 21.52 | 16.84 | 18.29 | 8.61 | 19.89 |
| Channel 4 inc +1 | 6.49 | 15.51 | 11.15 | 10.66 | 37.68 | 14.55 |
| % Ch YoY | 37.69 | 38.29 | 37.26 | 41.20 | 21.51 | 40.85 |
| Channel 5 | 5.01 | 14.16 | 7.75 | 7.61 | 30.41 | 12.21 |
| % Ch YoY | 7.57 | 14.41 | 3.83 | 9.31 | 2.24 | 0.41 |
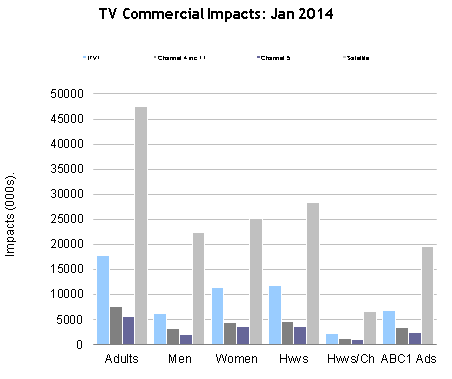
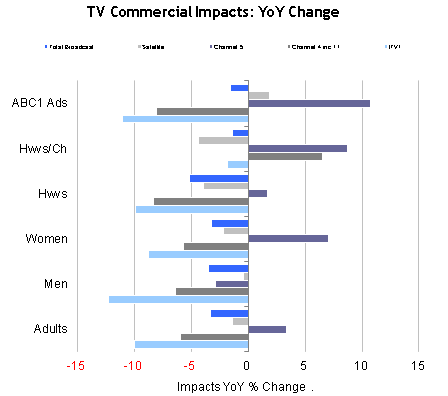
Commercial Impacts
| Impacts | Adults | Men | Women | Hwvs | Hwvs/Ch | ABC1 Adults |
|---|---|---|---|---|---|---|
| ITV1 | 17,734.02 | 6,301.70 | 11,432.33 | 11,746.45 | 2,238.43 | 6,730.92 |
| % Ch YoY | -10.01 | -12.25 | -8.73 | -9.85 | -1.82 | -11.05 |
| Channel 4 inc +1 | 7,620.43 | 3,187.03 | 4,433.41 | 4,639.30 | 1,312.09 | 3,397.48 |
| % Ch YoY | -5.94 | -6.35 | -5.65 | -8.29 | 6.56 | -8.05 |
| Channel 5 | 5,708.38 | 2,019.08 | 3,689.31 | 3,689.31 | 940.07 | 2,341.56 |
| % Ch YoY | 3.33 | -2.83 | 7.06 | 1.69 | 8.72 | 10.70 |
| Satellite | 47,533.80 | 22,299.08 | 25,234.66 | 28,427.95 | 6,608.09 | 19,515.83 |
| % Ch YoY | -1.33 | -0.40 | -2.15 | -3.95 | -4.39 | 1.84 |
| Total Broadcast | 79,977.64 | 34,244.37 | 45,733.24 | 49,508.53 | 11,335.94 | 32,505.69 |
| % Ch YoY | -3.30 | -3.44 | -3.19 | -5.18 | -1.34 | -1.57 |