


ITV1 enjoyed a 16.7% increase in network revenue in June, according to latest agency estimates. It was the only broadcaster in our analysis to record a rise, with Channel 4, Channel 5 and ITV Breakfast all posting year on year declines.
ITV’s Euro 2012 coverage featured heavily in the Top 20 Programme rankings in June – with the England v Ukraine match banking more than 16.2 million viewers.
Channel 4 recorded the biggest drop in revenue during June, down -10.3%. Channel 5, meanwhile, posted a -3.7% year on year fall. ITV Breakfast saw its revenues dip -3.3% compared with June 2011. Overall, Total Terrestrial (including ITV Breakfast) was up 6% YoY, while Total Satellite was up 4.9%.
Network Revenue
| Total Revenue | Jun 11 | Jun 12 | % Change |
|---|---|---|---|
| ITV1 | 88,730,000 | 103,540,000 | 16.7 |
| Channel 4 | 44,200,000 | 39,640,000 | -10.3 |
| Channel 5 | 19,840,000 | 19,100,000 | -3.7 |
| ITV Breakfast | 3,920,000 | 3,790,000 | -3.3 |
| Total Terrestrial (inc. ITV Breakfast) | 156,690,000 | 166,070,000 | 6.0 |
| Total Satellite | 96,150,000 | 100,900,000 | 4.9 |
Source: Agency Estimates
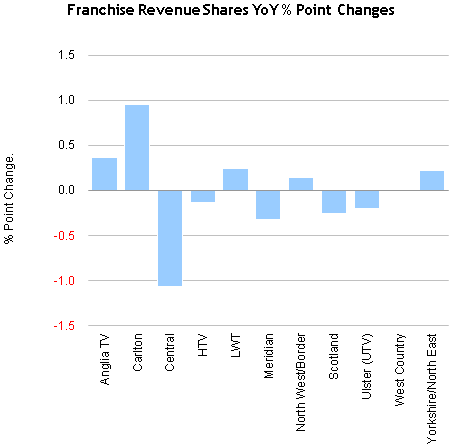
ITV Franchise Area
| % Share of ITV Revenue by Franchise | Jun 11 | Jun 12 | % Point Change |
|---|---|---|---|
| Anglia TV | 7.40 | 7.77 | 0.37 |
| Carlton | 13.92 | 14.87 | 0.95 |
| Central | 16.24 | 15.18 | -1.06 |
| HTV | 6.32 | 6.19 | -0.13 |
| LWT | 11.39 | 11.63 | 0.24 |
| Meridian | 11.86 | 11.54 | -0.32 |
| North West/Border | 10.54 | 10.68 | 0.14 |
| Scotland | 6.60 | 6.35 | -0.25 |
| Ulster (UTV) | 2.74 | 2.54 | -0.20 |
| West Country | 1.92 | 1.93 | 0.01 |
| Yorkshire/North East | 11.09 | 11.31 | 0.22 |
Network CPTs
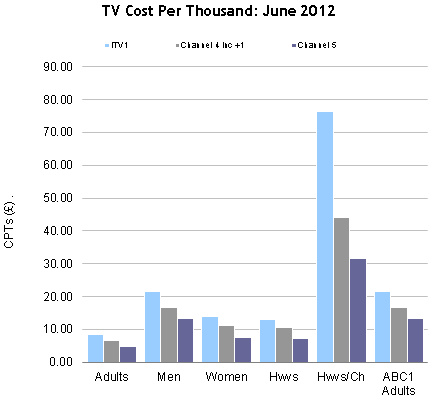
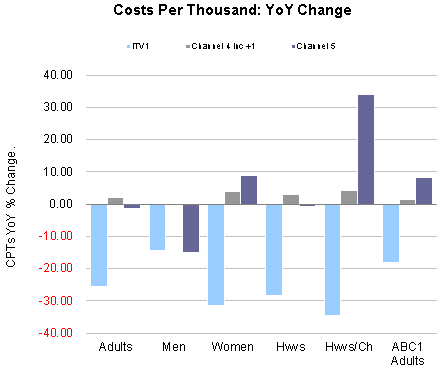
| CPTs | Adults | Men | Women | Hwvs | Hwvs/Ch | ABC1 Adults |
|---|---|---|---|---|---|---|
| ITV1 | 8.48 | 21.55 | 13.99 | 12.89 | 76.31 | 21.43 |
| % Ch YoY | -25.66 | -14.48 | -31.47 | -28.24 | -34.53 | -18.15 |
| Channel 4 inc +1 | 6.68 | 16.67 | 11.16 | 10.52 | 44.07 | 16.78 |
| % Ch YoY | 2.13 | -0.18 | 3.74 | 3.06 | 4.20 | 1.41 |
| Channel 5 | 4.86 | 13.45 | 7.61 | 7.15 | 31.50 | 13.26 |
| % Ch YoY | -1.33 | -15.16 | 8.69 | -0.71 | 33.81 | 8.22 |
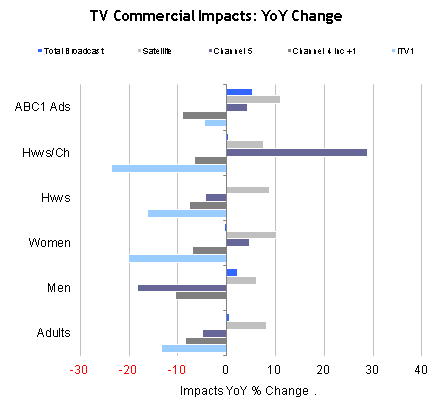
Commercial Impacts
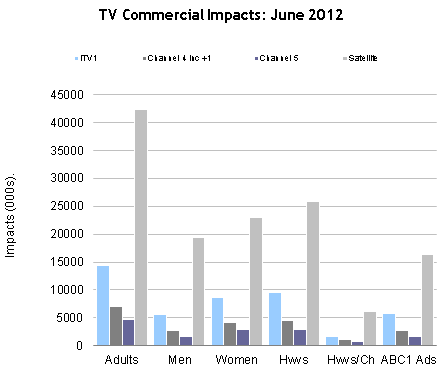
| Impacts | Adults | Men | Women | Hwvs | Hwvs/Ch | ABC1 Adults |
|---|---|---|---|---|---|---|
| ITV1 | 14,357.25 | 5,652.39 | 8,704.86 | 9,447.23 | 1,596.26 | 5,683.34 |
| % Ch YoY | -13.25 | -0.20 | -20.03 | -16.25 | -23.60 | -4.48 |
| Channel 4 inc +1 | 6,976.65 | 2,797.64 | 4,178.98 | 4,432.27 | 1,058.25 | 2,779.41 |
| % Ch YoY | -8.40 | -10.47 | -6.96 | -7.57 | -6.54 | -9.04 |
| Channel 5 | 4,625.33 | 1,670.98 | 2,954.34 | 2,954.34 | 713.47 | 1,694.71 |
| % Ch YoY | -5.01 | -18.32 | 4.63 | -4.41 | 28.82 | 4.18 |
| Satellite | 42,308.47 | 19,354.74 | 22,953.51 | 25,922.64 | 6,176.88 | 16,359.29 |
| % Ch YoY | 8.23 | 6.05 | 10.15 | 8.73 | 7.54 | 10.96 |
| Total Broadcast | 69,402.83 | 29,943.08 | 39,459.49 | 43,687.30 | 9,712.77 | 27,051.34 |
| % Ch YoY | 0.66 | 2.20 | -0.47 | -0.34 | 0.40 | 5.25 |
TV market data is available in
mediatel.co.uk’s TV Database.





