Commercial terrestrial television channels saw an overall decline in yearly revenues in June, with total terrestrial down -8.7%. However, total satellite saw a healthy year on year increase of 23.4%.
ITV1 suffered the biggest revenue hit, down -15.6%, followed by ITV Breakfast (-1.8%) and Channel 4 (-0.5%).
Only Channel 5 saw any growth in the terrestrial sector, up 9.9% to a yearly revenue just short of £21 million.
Network Revenue
| Total Revenue | Jun-12 | Jun-13 | % Change |
|---|---|---|---|
| ITV1 | 103,540,000 | 87,420,000 | -15.6 |
| Channel 4 | 39,640,000 | 39,450,000 | -0.5 |
| Channel 5 | 19,100,000 | 20,990,000 | 9.9 |
| ITV Breakfast | 3,790,000 | 3,720,000 | -1.8 |
| Total Terrestrial (inc. ITV Breakfast) | 166,070,000 | 151,580,000 | -8.7 |
| Total Satellite | 100,900,000 | 124,470,000 | 23.4 |
Source: Agency Estimates
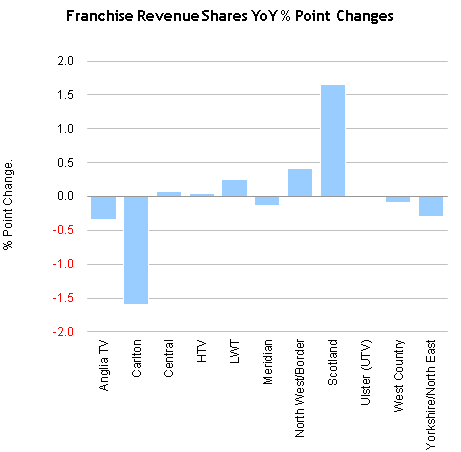
ITV Franchise Area
| % Share of ITV Revenue by Franchise | Jun-12 | Jun-13 | % Point Change |
|---|---|---|---|
| Anglia TV | 7.77 | 7.43 | -0.34 |
| Carlton | 14.87 | 13.27 | -1.60 |
| Central | 15.18 | 15.25 | 0.07 |
| HTV | 6.19 | 6.23 | 0.04 |
| LWT | 11.63 | 11.88 | 0.25 |
| Meridian | 11.54 | 11.40 | -0.14 |
| North West/Border | 10.68 | 11.09 | 0.41 |
| Scotland | 6.35 | 8.01 | 1.66 |
| Ulster (UTV) | 2.54 | 2.56 | 0.02 |
| West Country | 1.93 | 1.84 | -0.09 |
| Yorkshire/North East | 11.31 | 11.02 | -0.29 |
Network CPTs
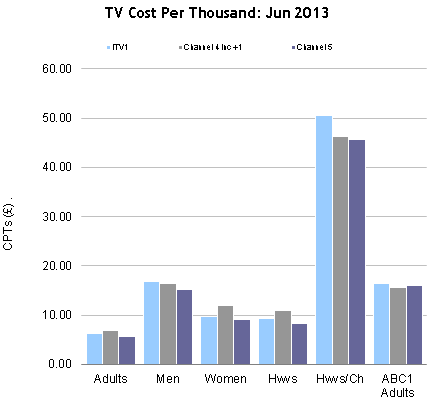
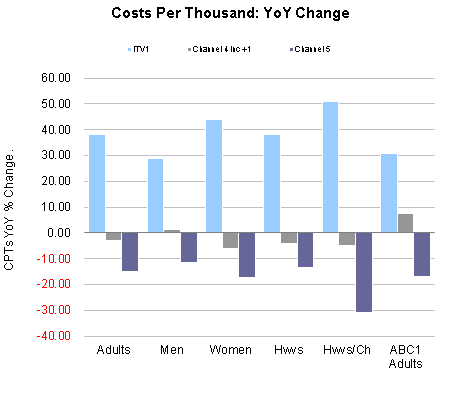
| CPTs | Adults | Men | Women | Hwvs | Hwvs/Ch | ABC1 Adults |
|---|---|---|---|---|---|---|
| ITV1 | 6.14 | 16.71 | 9.72 | 9.33 | 50.53 | 16.38 |
| % Ch YoY | 38.10 | 28.90 | 44.00 | 38.20 | 51.00 | 30.90 |
| Channel 4 inc +1 | 6.90 | 16.44 | 11.88 | 10.96 | 46.30 | 15.59 |
| % Ch YoY | -3.10 | 1.40 | -6.10 | -4.00 | -4.80 | 7.60 |
| Channel 5 | 5.73 | 15.23 | 9.18 | 8.26 | 45.58 | 15.96 |
| % Ch YoY | -15.20 | -11.70 | -17.20 | -13.40 | -30.90 | -16.90 |
Commercial Impacts
| Impacts | Adults | Men | Women | Hwvs | Hwvs/Ch | ABC1 Adults |
|---|---|---|---|---|---|---|
| ITV1 | 16,737.41 | 6,153.79 | 10,583.63 | 11,019.69 | 2,035.26 | 6,280.65 |
| % Ch YoY | -6.28 | -3.93 | -7.60 | -8.07 | -9.68 | -6.50 |
| Channel 4 inc +1 | 6,730.19 | 2,823.95 | 3,906.23 | 4,236.54 | 1,002.53 | 2,976.31 |
| % Ch YoY | -15.84 | -12.75 | -17.95 | -16.33 | -20.33 | -10.44 |
| Channel 5 | 4,311.09 | 1,621.68 | 2,689.41 | 2,689.41 | 541.75 | 1,546.85 |
| % Ch YoY | -19.41 | -28.96 | -12.30 | -16.22 | -10.90 | -19.05 |
| Satellite | 43,306.81 | 19,916.15 | 23,390.75 | 26,682.46 | 6,335.96 | 17,185.81 |
| % Ch YoY | 0.03 | -0.07 | 0.12 | 1.04 | -0.95 | -0.08 |
| Total Broadcast | 72,305.22 | 30,912.17 | 41,393.19 | 45,798.08 | 10,121.00 | 28,496.57 |
| % Ch YoY | -4.23 | -3.88 | -4.48 | -4.10 | -5.26 | -3.64 |


TV market data is available in
mediatel.co.uk’s TV Database.