
The broadcasters’ network revenue results for March show lots of change once again. ITV1 was the only broadcaster to enjoy an increase on March 2011, up 1.4%.
ITV had a run of ratings success in March with the new series of Britain’s Got Talent, Sunday night favourites Dancing on Ice and Titanic, and prime time crime drama Scott & Bailey. Britain’s Got Talent, with new judges David Walliams and Alesha Dixon, topped the programme rankings in the month with more than 11.5 million viewers.
Meanwhile, Channel 4 saw a slight dip in revenue in March, down -0.1%, while Channel 5 posted a -2.9% decline YoY. In February, Channel 5 recorded a much more substantial -21.1% drop. ITV Breakfast suffered a -3.8% fall last month.
Overall, Total Terrestrial (including ITV Breakfast) was up 0.3% YoY, while Total Satellite was up 20.1%.
Network Revenue
| Total Revenue | Mar 11 | Mar 12 | % Change |
|---|---|---|---|
| ITV1 | 108,090,000 | 109,600,000 | 1.4 |
| Channel 4 | 51,270,000 | 51,200,000 | -0.1 |
| Channel 5 | 21,550,000 | 20,920,000 | -2.9 |
| ITV Breakfast | 4,990,000 | 4,800,000 | -3.8 |
| Total Terrestrial (inc. ITV Breakfast) | 185,900,000 | 186,520,000 | 0.3 |
| Total Satellite | 110,110,000 | 132,210,000 | 20.1 |
Source: Agency Estimates
ITV Franchise Area
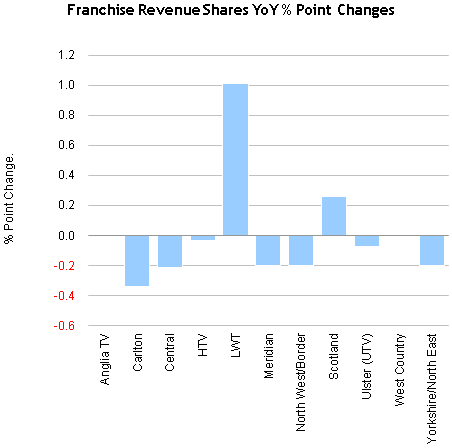
| % Share of ITV Revenue by Franchise | Mar 11 | Mar 12 | % Point Change |
|---|---|---|---|
| Anglia TV | 7.83 | 7.83 | n/a |
| Carlton | 14.71 | 14.37 | -0.34 |
| Central | 15.97 | 15.76 | -0.21 |
| HTV | 6.49 | 6.46 | -0.03 |
| LWT | 10.71 | 11.72 | 1.01 |
| Meridian | 11.87 | 11.67 | -0.20 |
| North West/Border | 10.35 | 10.15 | -0.20 |
| Scotland | 6.53 | 6.79 | 0.26 |
| Ulster (UTV) | 2.86 | 2.79 | -0.07 |
| West Country | 2.02 | 2.03 | 0.01 |
| Yorkshire/North East | 10.65 | 10.45 | -0.20 |
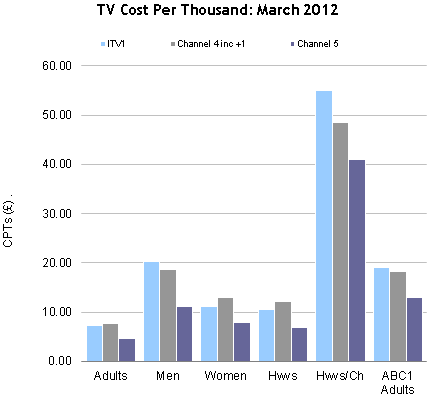
Network CPTs
| CPTs | Adults | Men | Women | Hwvs | Hwvs/Ch | ABC1 Adults |
|---|---|---|---|---|---|---|
| ITV1 | 7.16 | 20.29 | 11.07 | 10.60 | 55.09 | 19.02 |
| % Ch YoY | -8.46 | -9.06 | -8.13 | -8.11 | -8.48 | -3.57 |
| Channel 4 inc +1 | 7.60 | 18.54 | 12.87 | 12.06 | 48.53 | 18.21 |
| % Ch YoY | 0.72 | 3.22 | -0.94 | -0.88 | 3.86 | -1.99 |
| Channel 5 | 4.63 | 11.12 | 7.92 | 6.90 | 40.94 | 12.87 |
| % Ch YoY | -1.87 | -0.94 | -2.52 | -3.03 | -14.41 | 4.47 |

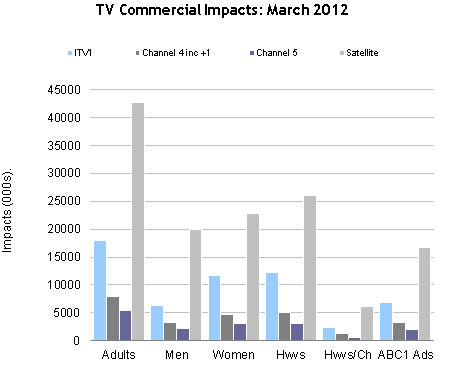
Commercial Impacts
| Impacts | Adults | Men | Women | Hwvs | Hwvs/Ch | ABC1 Adults |
|---|---|---|---|---|---|---|
| ITV1 | 18,001.34 | 6,356.30 | 11,645.07 | 12,159.73 | 2,340.59 | 6,779.54 |
| % Ch YoY | -7.18 | -7.79 | -6.84 | -6.82 | -7.19 | -2.22 |
| Channel 4 inc +1 | 7,929.23 | 3,248.20 | 4,680.99 | 4,996.40 | 1,241.30 | 3,308.45 |
| % Ch YoY | 0.58 | 3.07 | -1.07 | -1.01 | 3.72 | -2.11 |
| Channel 5 | 5,320.68 | 2,212.59 | 3,108.10 | 3,108.10 | 601.18 | 1,912.73 |
| % Ch YoY | -4.73 | -3.83 | -5.37 | -5.86 | -16.91 | 1.41 |
| Satellite | 42,759.11 | 19,927.07 | 22,832.01 | 26,132.58 | 6,110.09 | 16,714.36 |
| % Ch YoY | 3.85 | 4.53 | 3.25 | 2.75 | 0.72 | 5.52 |
| Total Broadcast | 75,116.81 | 32,065.59 | 43,051.20 | 47,666.91 | 10,491.50 | 29,182.38 |
| % Ch YoY | -0.15 | 0.98 | -0.99 | -1.01 | -2.44 | 2.48 |