May figures show that ITV1’s revenue was up 22.4% year on year, to £123 million.
Channel 4’s revenue was up an impressive 31.8% year on year, to £60.5 million.
Also up were Five (+19.1% to £21.4 million) and GMTV (+16.9% to £4.9 million).
Total terrestrial television revenue now stands at around the £210 million mark following a total increase of 24.4%.
| Total Revenue | May 09 | May 10 | % Change |
|---|---|---|---|
| ITV1 | 100,580,000 | 123,070,000 | 22.4 |
| C4 | 45,950,000 | 60,540,000 | 31.8 |
| Five | 17,930,000 | 21,360,000 | 19.1 |
| GMTV | 4,190,000 | 4,900,000 | 16.9 |
| Total Terrestrial (inc. GMTV) | 168,650,000 | 209,870,000 | 24.4 |
| Total Satellite | 87,430,000 | 117,010,000 | 33.8 |
Source: Agency estimates
ITV Franchises
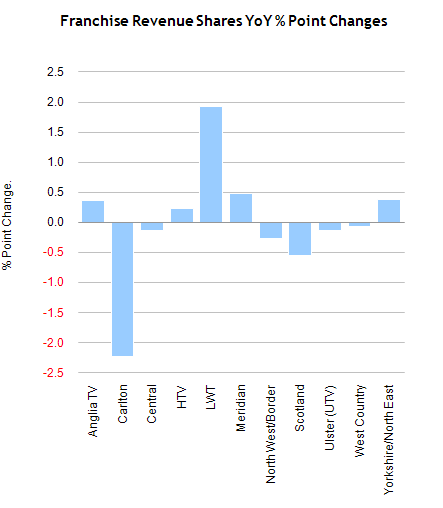
Of the six ITV franchise regions with a revenue share above 10%, three recorded year on year growth.
LWT enjoyed the biggest increase, up 1.93 percentage points to 13.75%.
Meridian provided an 11.8% share, up 0.48 percentage points, while Yorkshire/North East grew 0.39 percentage points to 10.65%.
Elsewhere, Central provided a 15.62% share, down 0.14 percentage points, while Carlton’s 12.83% share was down 2.23 percentage points on May 2009.
Down 0.27 percentage points, North West/Border provided a 10.29% share.
| % Share of ITV Revenue by Franchise | May 09 | May 10 | % Point Change |
|---|---|---|---|
| Anglia TV | 7.29 | 7.65 | 0.36 |
| Carlton | 15.06 | 12.83 | -2.23 |
| Central | 15.76 | 15.62 | -0.14 |
| HTV | 6.42 | 6.65 | 0.23 |
| LWT | 11.82 | 13.75 | 1.93 |
| Meridian | 11.32 | 11.80 | 0.48 |
| North West/Border | 10.56 | 10.29 | -0.27 |
| Scotland | 6.89 | 6.34 | -0.55 |
| Ulster (UTV) | 2.50 | 2.37 | -0.13 |
| West Country | 2.11 | 2.04 | -0.07 |
| Yorkshire/North East | 10.26 | 10.65 | 0.39 |
Costs Per Thousand
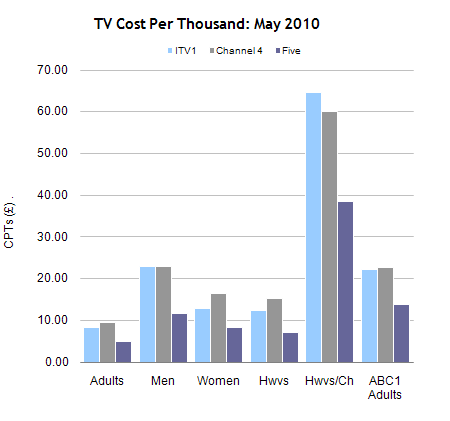
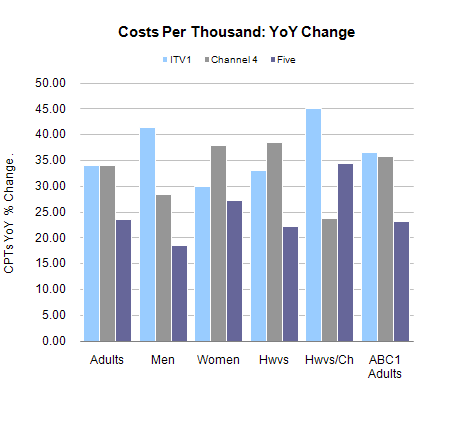
ITV1’s biggest cost per thousand increase was in the Housewives with Children category, up 45% year on year.
At Channel 4, there was a 38.5% increase in the Housewives audience, while the biggest growth in Five’s CPT price was for Housewives with Children, up 34.3%.
>
| CPTs | Adults | Men | Women | Hwvs | Hwvs/Ch | ABC1 Adults |
| ITV1 | 8.18 | 22.91 | 12.73 | 12.26 | 64.64 | 22.09 |
|---|---|---|---|---|---|---|
| % Ch YoY | 34.0 | 41.3 | 30.0 | 33.1 | 45.0 | 36.6 |
| Channel 4 | 9.56 | 22.97 | 16.38 | 15.14 | 60.02 | 22.54 |
| % Ch YoY | 34.0 | 28.4 | 37.9 | 38.5 | 23.8 | 35.8 |
| Five | 4.83 | 11.65 | 8.25 | 7.13 | 38.36 | 13.79 |
| % Ch YoY | 23.6 | 18.5 | 27.3 | 22.1 | 34.3 | 23.2 |
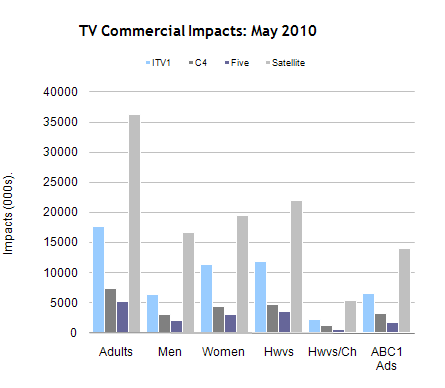
Commercial Impacts
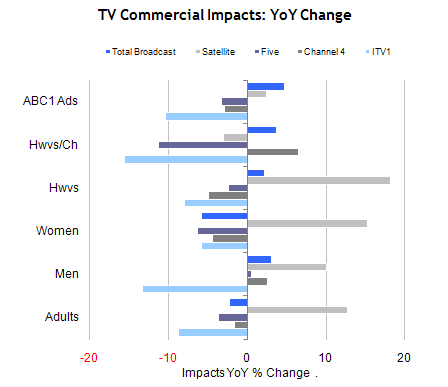
Commercial impacts were down across the board for ITV1 in May, with the biggest decline for Housewives with Children, down 15.6% year on year.
Channel 4 saw increases in two audiences, Men (+2.6%) and Housewives with Children (+6.5%).
Looking at Five, the only audience not to see a fall was Men, up 0.6%.
Total Broadcast commercial impacts were up in four categories, with the biggest increase for ABC1 Adults, up 4.8%.
| Impacts | Adults | Men | Women | Hwvs | Hwvs/Ch | ABC1 Adults |
|---|---|---|---|---|---|---|
| ITV1 | 17,694 | 6,319 | 11,375 | 11,807 | 2,240 | 6,555 |
| % Ch YoY | -8.7 | -13.4 | -5.9 | -8.0 | -15.6 | -10.4 |
| C4 | 7,450 | 3,101 | 4,349 | 4,704 | 1,187 | 3,159 |
| % Ch YoY | -1.7 | 2.6 | -4.5 | -4.9 | 6.5 | -3.0 |
| Five | 5,202 | 2,157 | 3,045 | 3,523 | 655 | 1,822 |
| % Ch YoY | -3.6 | 0.6 | -6.4 | -2.5 | -11.3 | -3.3 |
| Satellite | 36,256 | 16,740 | 19,516 | 22,060 | 5,474 | 14,092 |
| % Ch YoY | 12.7 | 10.0 | 15.2 | 18.2 | -3.1 | 2.5 |
| Total Broadcast | 26,152 | 67,967 | 9,818 | 28,707 | 39,260 | 43,087 |
| % Ch YoY | -2.3 | 3.1 | -5.8 | 2.2 | 3.7 | 4.8 |