Commercial terrestrial television channels have seen their advertising revenues continue to decline year-on-year with new data showing another fall for the period November 2011 – 12.
Channel 4 saw the biggest drop, down £5 million (-8.2%) on the previous year’s total revenue, followed by Channel 5 (-4.4%) and ITV1 (-2.8%).
Only ITV Breakfast saw a small 1.9% increase (equating to only £110,000). Total satellite also saw a small amount of growth with a 1.6% increase to £135.9 million for the year.
The figures were not as severe as the last figures for the Oct 2011 – 12 period which saw drops of up to 12% for some networks, but this is likely due to seasonal ad placements in the run up to Christmas.
Network Revenue
| Total Revenue | Nov 11 | Nov 12 | % Change |
|---|---|---|---|
| ITV1 | 137,310,000 | 133,400,000 | -2.8 |
| Channel 4 | 61,000,000 | 56,000,000 | -8.2 |
| Channel 5 | 30,570,000 | 29,210,000 | -4.4 |
| ITV Breakfast | 5,900,000 | 6,010,000 | 1.9 |
| Total Terrestrial (inc. ITV Breakfast) | 234,780,000 | 224,620,000 | -4.3 |
| Total Satellite | 133,700,000 | 135,890,000 | 1.6 |
Source: Agency Estimates
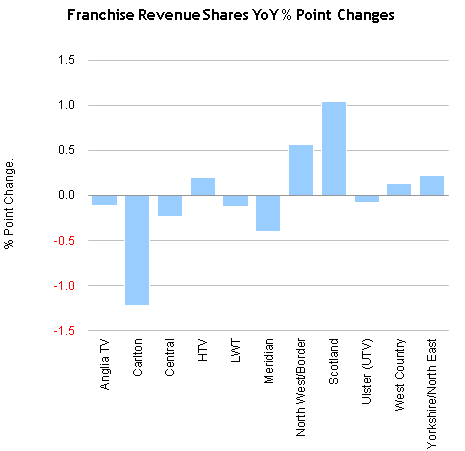
ITV Franchise Area
| % Share of ITV Revenue by Franchise | Nov 11 | Nov 12 | % Point Change |
|---|---|---|---|
| Anglia TV | 7.93 | 7.82 | -0.11 |
| Carlton | 13.48 | 12.26 | -1.22 |
| Central | 15.83 | 15.60 | -0.23 |
| HTV | 6.32 | 6.52 | 0.20 |
| LWT | 12.99 | 12.87 | -0.12 |
| Meridian | 11.96 | 11.56 | -0.40 |
| North West/Border | 10.12 | 10.68 | 0.56 |
| Scotland | 6.22 | 7.26 | 1.04 |
| Ulster (UTV) | 2.41 | 2.33 | -0.08 |
| West Country | 2.04 | 2.17 | 0.13 |
| Yorkshire/North East | 10.71 | 10.93 | 0.22 |
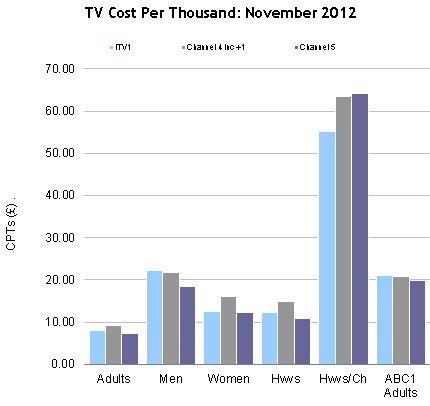
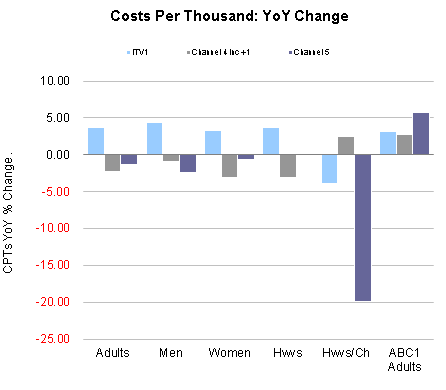
Network CPTs
| CPTs | Adults | Men | Women | Hwvs | Hwvs/Ch | ABC1 Adults |
|---|---|---|---|---|---|---|
| ITV1 | 7.96 | 22.32 | 12.38 | 12.16 | 55.08 | 21.09 |
| % Ch YoY | 3.67 | 4.38 | 3.27 | 3.75 | -3.91 | 3.16 |
| Channel 4 inc +1 | 9.19 | 21.65 | 15.98 | 14.84 | 63.35 | 20.76 |
| % Ch YoY | -2.22 | -0.97 | -3.12 | -3.09 | 2.52 | 2.74 |
| Channel 5 | 7.35 | 18.32 | 12.27 | 10.78 | 64.15 | 19.79 |
| % Ch YoY | -1.37 | -2.47 | -0.62 | 0.20 | -19.88 | 5.71 |
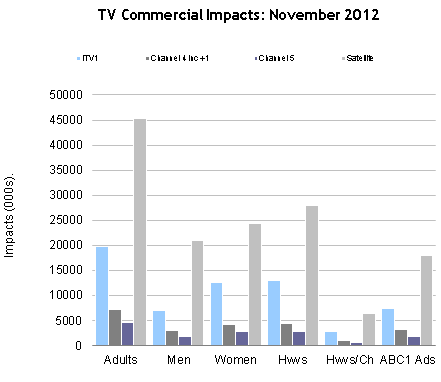
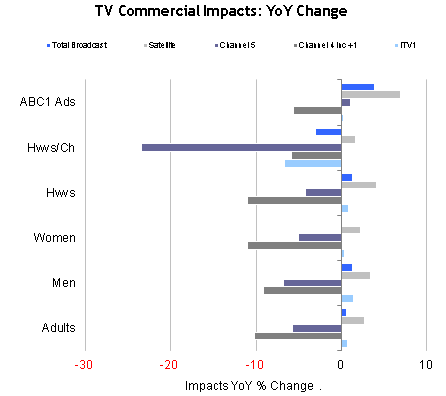
Commercial Impacts
| Impacts | Adults | Men | Women | Hwvs | Hwvs/Ch | ABC1 Adults |
|---|---|---|---|---|---|---|
| ITV1 | 19,706.80 | 7,031.70 | 12,675.04 | 12,910.42 | 2,849.52 | 7,443.11 |
| % Ch YoY | 0.71 | 1.40 | 0.33 | 0.79 | -6.64 | 0.22 |
| Channel 4 inc +1 | 7,165.47 | 3,043.57 | 4,121.89 | 4,440.80 | 1,040.01 | 3,174.08 |
| % Ch YoY | -10.23 | -9.08 | -11.05 | -11.03 | -5.88 | -5.68 |
| Channel 5 | 4,677.31 | 1,875.95 | 2,801.33 | 2,801.33 | 535.71 | 1,736.19 |
| % Ch YoY | -5.72 | -6.76 | -5.01 | -4.23 | -23.43 | 1.01 |
| Satellite | 45,295.20 | 21,032.57 | 24,262.48 | 27,991.44 | 6,402.05 | 17,978.34 |
| % Ch YoY | 2.71 | 3.34 | 2.17 | 4.06 | 1.60 | 6.88 |
| Total Broadcast | 78,526.26 | 33,597.37 | 44,928.64 | 49,655.56 | 11,115.79 | 31,110.33 |
| % Ch YoY | 0.57 | 1.32 | 0.01 | 1.30 | -3.08 | 3.86 |
>
TV market data is available in
mediatel.co.uk’s TV Database.