Commercial terrestrial television channels saw their advertising revenues decline slightly year on year for September.
Total revenue for commercial terrestrial TV dropped £4 million to £192 million – a 2.2% decline. However, total satellite advertising revenue rose by 18.8% to £129 million – a rise of £20 million.
In the terrestrial sector the biggest loser was Channel 4 with a decline of 8.6% to just under £50 million, despite the success of broadcasting the Paralympics up to 9 September. In contrast Channel 5 saw a revenue rise of 8.5% to £25.7 million. ITV1 was down 1.8% to £111.7 million.
Network Revenue
| Total Revenue | Sep 11 | Sep 12 | % Change |
|---|---|---|---|
| ITV1 | 113,670,000 | 111,650,000 | -1.8 |
| Channel 4 | 54,540,000 | 49,850,000 | -8.6 |
| Channel 5 | 23,680,000 | 25,690,000 | 8.5 |
| ITV Breakfast | 4,540,000 | 4,950,000 | 9.0 |
| Total Terrestrial (inc. ITV Breakfast) | 196,430,000 | 192,140,000 | -2.2 |
| Total Satellite | 109,050,000 | 129,530,000 | 18.8 |
Source: Agency Estimates
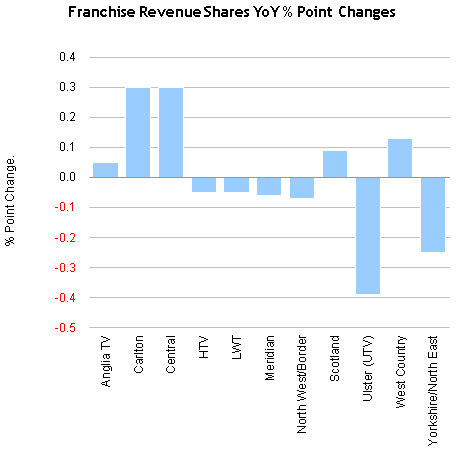
ITV Franchise Area
| % Share of ITV Revenue by Franchise | Sept 11 | Sep 12 | % Point Change |
|---|---|---|---|
| Anglia TV | 7.70 | 7.75 | 0.05 |
| Carlton | 13.33 | 13.63 | 0.30 |
| Central | 15.05 | 15.35 | 0.30 |
| HTV | 6.21 | 6.16 | -0.05 |
| LWT | 13.28 | 13.23 | -0.05 |
| Meridian | 11.96 | 11.90 | -0.06 |
| North West/Border | 10.38 | 10.31 | -0.07 |
| Scotland | 6.44 | 6.53 | 0.09 |
| Ulster (UTV) | 2.84 | 2.45 | -0.39 |
| West Country | 1.93 | 2.06 | 0.13 |
| Yorkshire/North East | 10.88 | 10.63 | -0.25 |
Network CPTs
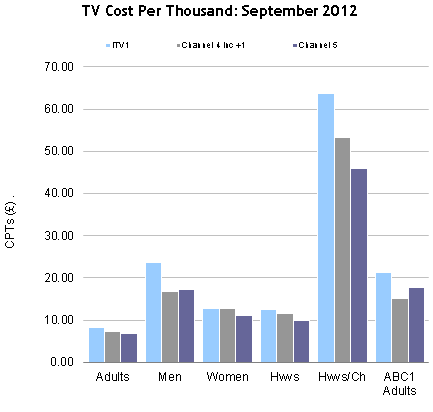
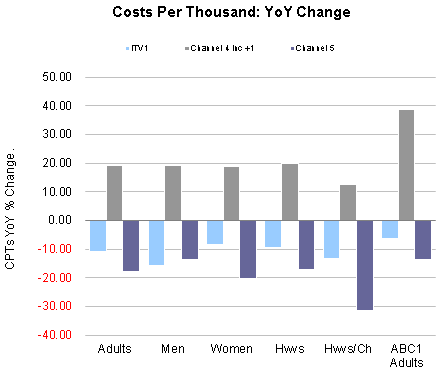
| CPTs | Adults | Men | Women | Hwvs | Hwvs/Ch | ABC1 Adults |
|---|---|---|---|---|---|---|
| ITV1 | 8.30 | 23.66 | 12.79 | 12.39 | 63.72 | 21.23 |
| % Ch YoY | -11.03 | -15.64 | -8.33 | -9.45 | -13.48 | -6.49 |
| Channel 4 inc +1 | 7.21 | 16.75 | 12.68 | 11.63 | 53.32 | 15.22 |
| % Ch YoY | 18.97 | 19.25 | 18.75 | 19.95 | 12.48 | 38.54 |
| Channel 5 | 6.72 | 17.23 | 11.01 | 9.95 | 46.01 | 17.81 |
| % Ch YoY | -17.76 | -13.55 | -20.25 | -17.26 | -31.62 | -13.75 |
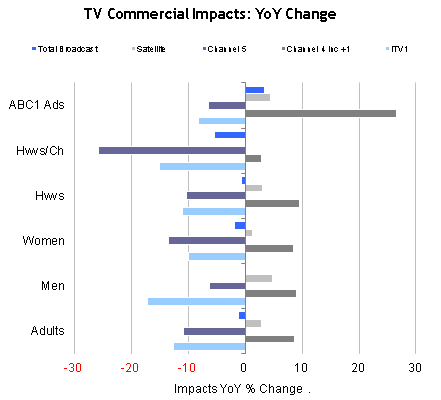
Commercial Impacts
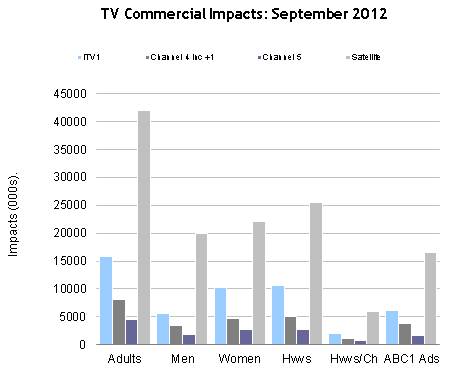
| Impacts | Adults | Men | Women | Hwvs | Hwvs/Ch | ABC1 Adults |
|---|---|---|---|---|---|---|
| ITV1 | 15,824.52 | 5,552.00 | 10,272.52 | 10,597.68 | 2,061.49 | 6,187.60 |
| % Ch YoY | -12.61 | -17.14 | -9.95 | -11.06 | -15.01 | -8.15 |
| Channel 4 inc +1 | 8,129.16 | 3,502.23 | 4,626.94 | 5,042.80 | 1,099.98 | 3,854.61 |
| % Ch YoY | 8.73 | 8.99 | 8.53 | 9.63 | 2.80 | 26.62 |
| Channel 5 | 4,500.46 | 1,754.26 | 2,746.19 | 2,746.19 | 656.91 | 1,697.42 |
| % Ch YoY | -10.78 | -6.21 | -13.47 | -10.23 | -25.80 | -6.42 |
| Satellite | 42,028.71 | 19,916.28 | 22,112.83 | 25,481.43 | 5,963.95 | 16,613.44 |
| % Ch YoY | 2.90 | 4.75 | 1.30 | 3.08 | -0.14 | 4.43 |
| Total Broadcast | 71,628.43 | 31,087.63 | 40,541.20 | 44,974.92 | 9,992.38 | 28,887.81 |
| % Ch YoY | -1.13 | -0.10 | -1.89 | -0.70 | -5.34 | 3.42 |
TV market data is available in
mediatel.co.uk’s TV Database.