
While April was a strong month for UK commercial TV broadcasters, just one recorded an increase in network revenue in May, with total terrestrial channels down -3.6% on the previous year.
Channel 4 boosted revenue by 8.7% in May to a little over £49.2 million, firmly securing its place as the second-highest revenue generating commercial broadcaster behind ITV 1.
A -6.4% decrease in revenue, however, took ITV from £125 million in May 2014 to £117 million this year – although the total figure is still leaps and bounds ahead of Channel 4 and Channel 5.
Channel 5 suffered the most in May, down -10.3% year on year to lose £2.7 million and finish the month with £23.6 million, while a -4.1% decline over the year made little difference to ITV Breakfast’s £5.1 million.
While total terrestrial was down from over £201 million to £194.6 million, total satellite was up 10.3% to £161.6 million.
Network Revenue
| Total Revenue | May 14 | May 15 | % Change |
|---|---|---|---|
| ITV1 | 125,000,000 | 117,030,000 | -6.4 |
| Channel 4 | 45,260,000 | 49,220,000 | 8.7 |
| Channel 5 | 26,260,000 | 23,550,000 | -10.3 |
| ITV Breakfast | 5,320,000 | 5,100,000 | -4.1 |
| Total Terrestrial (inc. ITV Breakfast) | 201,840,000 | 194,900,000 | -3.4 |
| Total Satellite | 146,550,000 | 161,620,000 | 10.3 |
Source: Agency Estimates
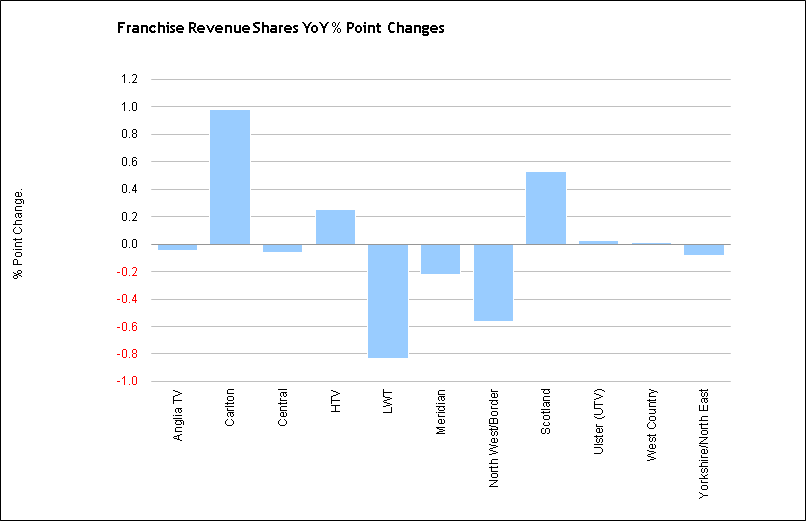
ITV Franchise Area
| % Share of ITV Revenue by Franchise | May 14 | May 15 | % Point Change |
|---|---|---|---|
| Anglia TV | 7.71 | 7.66 | -0.05 |
| Carlton | 11.95 | 12.93 | 0.98 |
| Central | 15.51 | 15.45 | -0.06 |
| HTV | 6.06 | 6.31 | 0.25 |
| LWT | 13.17 | 12.34 | -0.83 |
| Meridian | 11.56 | 11.34 | -0.22 |
| North West/Border | 11.04 | 10.48 | -0.56 |
| Scotland | 7.37 | 7.90 | 0.53 |
| Ulster (UTV) | 2.29 | 2.32 | 0.03 |
| West Country | 1.94 | 1.95 | 0.01 |
| Yorkshire/North East | 11.39 | 11.31 | -0.08 |
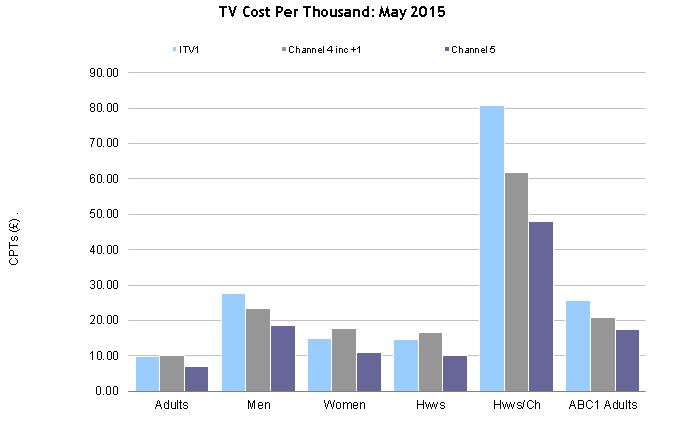
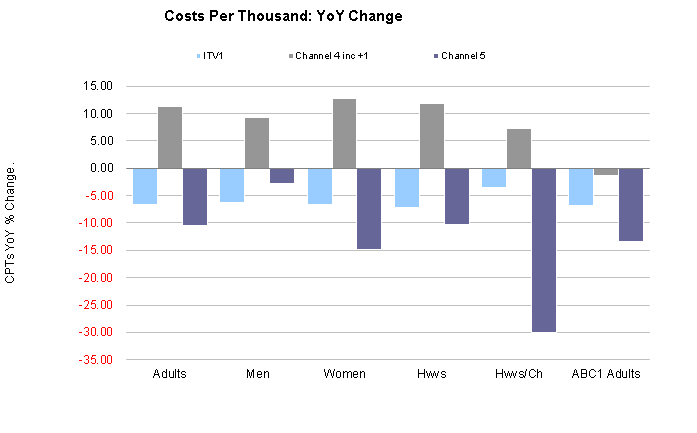
Network CPTs
| CPTs | Adults | Men | Women | Hwvs | Hwvs/Ch | ABC1 Adults |
|---|---|---|---|---|---|---|
| ITV1 | 9.70 | 27.62 | 14.96 | 14.51 | 80.79 | 25.52 |
| % Ch YoY | -6.54 | -6.29 | -6.68 | -7.23 | -3.59 | -6.87 |
| Channel 4 inc +1 | 10.11 | 23.35 | 17.84 | 16.54 | 61.68 | 20.72 |
| % Ch YoY | 11.26 | 9.33 | 12.73 | 11.85 | 7.30 | -1.37 |
| Channel 5 | 6.90 | 18.56 | 10.97 | 10.15 | 47.99 | 17.39 |
| % Ch YoY | -10.38 | -2.87 | -14.83 | -10.27 | -29.94 | -13.41 |
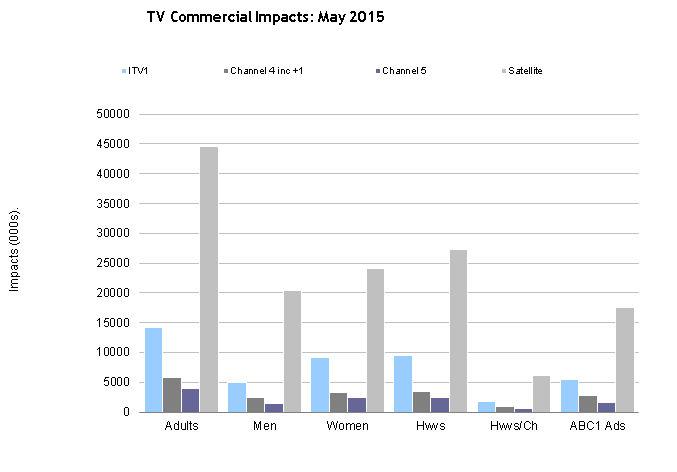
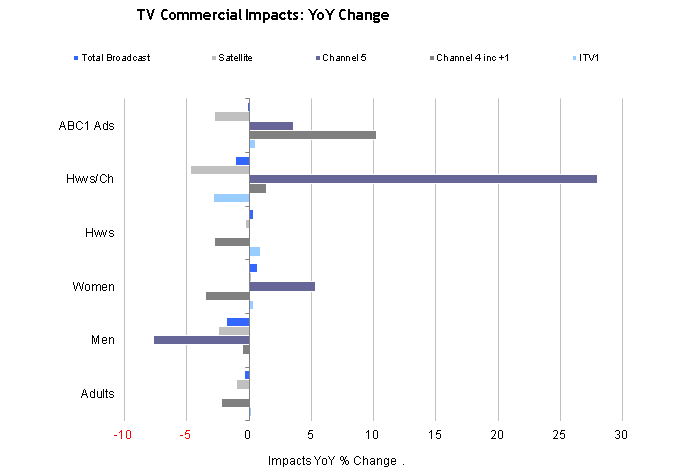
Commercial Impacts
| Impacts | Adults | Men | Women | Hwvs | Hwvs/Ch | ABC1 Adults |
|---|---|---|---|---|---|---|
| ITV1 | 14,188.87 | 4,985.89 | 9,202.93 | 9,491.21 | 1,704.34 | 5,395.47 |
| % Ch YoY | 0.18 | -0.08 | 0.32 | 0.91 | -2.89 | 0.53 |
| Channel 4 inc +1 | 5,726.14 | 2,480.29 | 3,245.87 | 3,500.30 | 938.80 | 2,794.87 |
| % Ch YoY | -2.25 | -0.53 | -3.52 | -2.77 | 1.35 | 10.26 |
| Channel 5 | 4,018.09 | 1,493.00 | 2,525.11 | 2,525.11 | 577.34 | 1,593.03 |
| % Ch YoY | 0.07 | -7.67 | 5.29 | -0.05 | 28.00 | 3.56 |
| Satellite | 44,500.16 | 20,455.30 | 24,044.77 | 27,267.69 | 6,124.19 | 17,600.34 |
| % Ch YoY | -1.06 | -2.50 | 0.19 | -0.29 | -4.74 | -2.83 |
| Total Broadcast | 70,251.59 | 30,029.20 | 40,222.26 | 44,208.34 | 9,689.06 | 28,144.87 |
| % Ch YoY | -0.38 | -1.80 | 0.70 | 0.33 | -1.09 | -0.16 |