For the latest Cross-Platform Report Nielsen has, for the first time, studied American viewer’s catch-up habits beyond the standard seven day period.
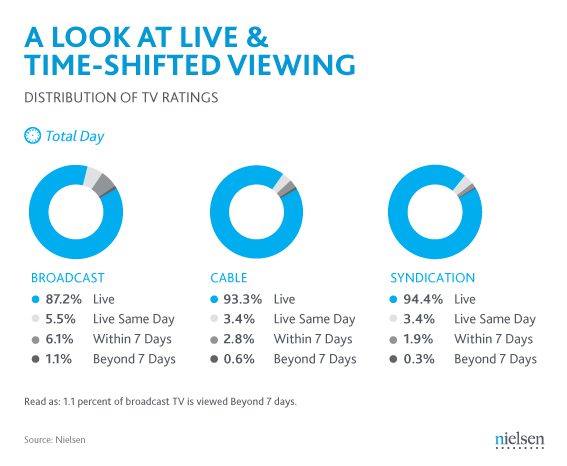
The study, which covers Q3 2012, states that live broadcast TV still accounts for 87% of viewing but there was an unexpectedly higher amount of people watching recorded material beyond the seven day period.
Content viewed on the same day as broadcast made up 5.5% of ratings while 6.1% of broadcast TV was watched within seven days. Only 1.1% is watched beyond that period. While nearly 99% of viewing is done so within seven days, the small amount left over is enough to affect ratings. Interestingly enough, the science fiction genre makes up the vast majority of ‘beyond seven’ content.
The report also stated that Americans spent more than 34 hours per week in front of a TV set in the third quarter of 2012.Traditional TV viewing was up 78 minutes from the previous quarter, as consumers continue to enjoy both live and time-shifted content, DVDs, or use their game consoles.
Content consumption doesn’t end with the TV – Americans also spent close to five hours a week on a computer screen, using the Internet and watching video content.
You can download a copy of the report over at Nielsen.