The latest RAJAR (Radio Joint Audience Research Ltd) results for the first quarter of 2013 show that listening to radio via a digital platform, in terms of weekly reach, has increased by 11% year on year (YoY).
26 million people now tune in to radio via a digitally enabled receiver each week, up by almost three million over the year.
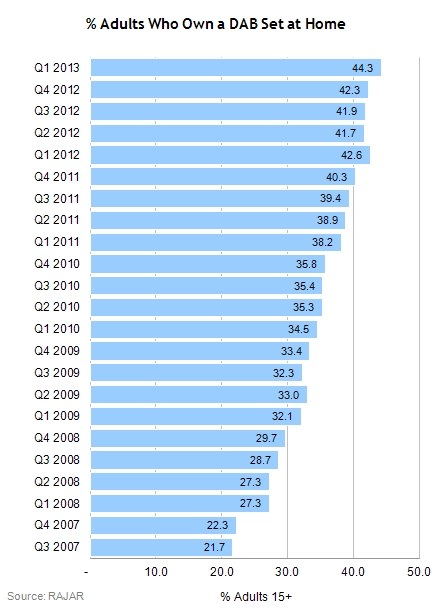
Adult ownership of DAB sets at home experienced a steady quarter on quarter increase of 2%, now at 44.3% in the UK (23 million adults). This has risen by almost 10% since 2010.
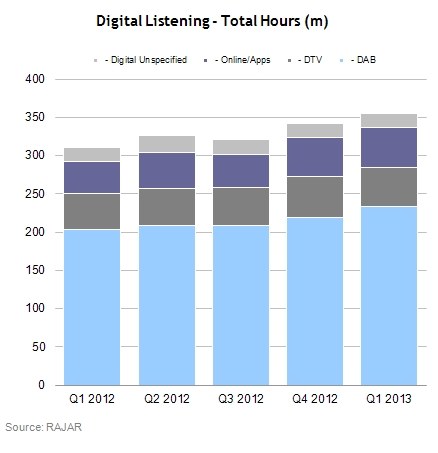
Digital listening hours for Q1 2013 increased from 311 million hours in Q1 2012 to a total of 355 million hours in Q1 2013 – a healthy 14% increase.
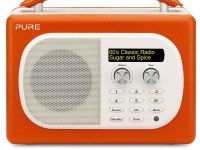
DAB radio continues to be the most popular device when it comes to listening to digital radio, now accounting for 66% of all digital hours – 233 million.
However, RAJAR’s digital results show the rise of the online platform when it comes to total hours, which was up by 24% year on year to 52 million hours – now representing 14.6% of all digital listening hours.
Radio listening via mobile devices is also becoming more popular among adults, with 20.3% of all adults having listened to radio via their mobile phone in the first quarter of 2013 – a 19% YoY increase. This is most popular among 15-24 year olds, with 37.4% of all young adults tuning in with their mobiles.
MediaTel has PowerPoint presentations available to download for subscribers, featuring pre-prepared market breakdown graphs for the latest RAJAR data release – click here.
| AM/FM | All Digital | – DAB | – DTV | – Online/Apps | – Digital Unspecified | |
|---|---|---|---|---|---|---|
| Platform Shares (%) | ||||||
| Q1 2012 | 63.1 | 29.2 | 19.1 | 4.4 | 3.9 | 1.8 |
| Q2 2012 | 61.1 | 31.5 | 20.1 | 4.7 | 4.6 | 2.1 |
| Q3 2012 | 61.8 | 31.3 | 20.4 | 4.8 | 4.2 | 1.9 |
| Q4 2012 | 62.6 | 33.0 | 21.1 | 5.1 | 4.9 | 1.9 |
| Q1 2013 | 60.5 | 34.3 | 22.5 | 5.0 | 5.0 | 1.8 |
| Digital Listening Weekly Reach (%) | ||||||
| Q1 2012 | n/a | 45.1 | 28.8 | 14.4 | 11.1 | 7.5 |
| Q2 2012 | n/a | 46.2 | 28.8 | 14.3 | 11.9 | 8.3 |
| Q3 2012 | n/a | 45.6 | 29.2 | 13.7 | 11.3 | 7.5 |
| Q4 2012 | n/a | 48.2 | 30.8 | 15.5 | 13.3 | 6.9 |
| Q1 2013 | n/a | 49.6 | 32.0 | 15.7 | 13.1 | 6.6 |
| Digital Listening Total Hours (m) | ||||||
| Q1 2012 | n/a | 311.0 | 203.0 | 47.0 | 42.0 | 19.0 |
| Q2 2012 | n/a | 326.0 | 208.0 | 49.0 | 47.0 | 22.0 |
| Q3 2012 | n/a | 320.0 | 209.0 | 49.0 | 43.0 | 20.0 |
| Q4 2012 | n/a | 342.0 | 219.0 | 53.0 | 51.0 | 19.0 |
| Q1 2013 | n/a | 355.0 | 233.0 | 51.0 | 52.0 | 19.0 |
Source: RAJAR