
April was a tough month for commercial terrestrial channels, with an across the board 9.8% decline in revenue.
The biggest individual fall was seen by ITV Breakfast, which posted a 15.5% year on year decrease to stand at £5.3m.
Channel 4 was down 10.1% to £49m, while the main ITV channel fell by 9.3% to just over £113m.
Meanwhile, total satellite posted strong revenues of £181m, an increase of 13% on April 2015 figure.
Network Revenue
| Total Revenue | Apr 15 | Apr 16 | % Change |
|---|---|---|---|
| ITV | 125,190,000 | 113,530,000 | -9.3 |
| Channel 4 | 54,560,000 | 49,050,000 | -10.1 |
| ITV Breakfast | 6,270,000 | 5,300,000 | -15.5 |
| Total ITV/C4/ITV Breakfast | 186,020,000 | 167,880,000 | -9.8 |
| Total Satellite | 160,580,000 | 181,390,000 | 13.0 |
Source: Agency Estimates
ITV Franchise Area
| % Share of ITV Revenue by Franchise | Apr 15 | Apr 16 | % Point Change |
|---|---|---|---|
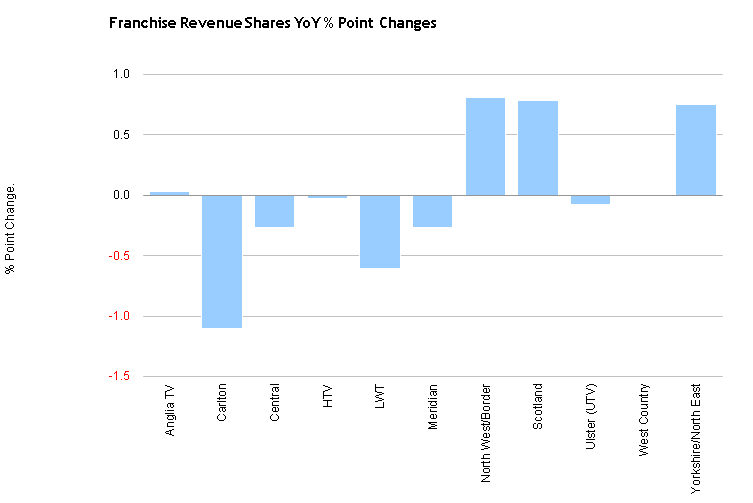
| Anglia TV | 7.64 | 7.67 | 0.03 |
| Carlton | 13.11 | 12.01 | -1.10 |
| Central | 16.15 | 15.88 | -0.27 |
| HTV | 6.43 | 6.40 | -0.03 |
| LWT | 11.64 | 11.03 | -0.61 |
| Meridian | 11.49 | 11.22 | -0.27 |
| North West/Border | 10.75 | 11.56 | 0.81 |
| Scotland | 7.36 | 8.14 | 0.78 |
| Ulster (UTV) | 2.29 | 2.21 | -0.08 |
| West Country | 1.93 | 1.93 | n/a |
| Yorkshire/North East | 11.20 | 11.95 | 0.75 |
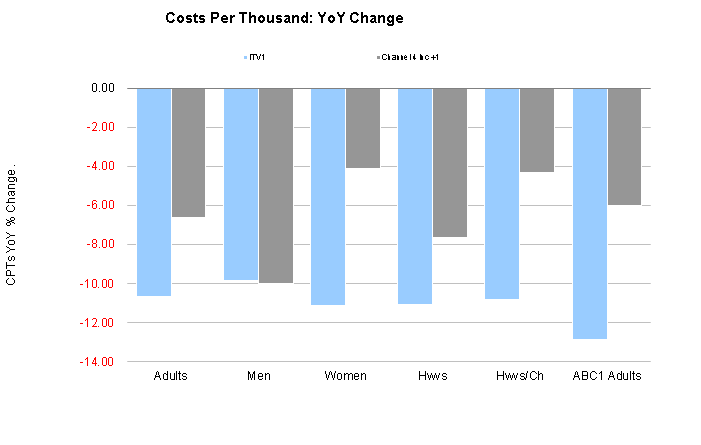
Network CPTs
| CPTs | Adults | Men | Women | Hwvs | Hwvs/Ch | ABC1 Adults |
|---|---|---|---|---|---|---|
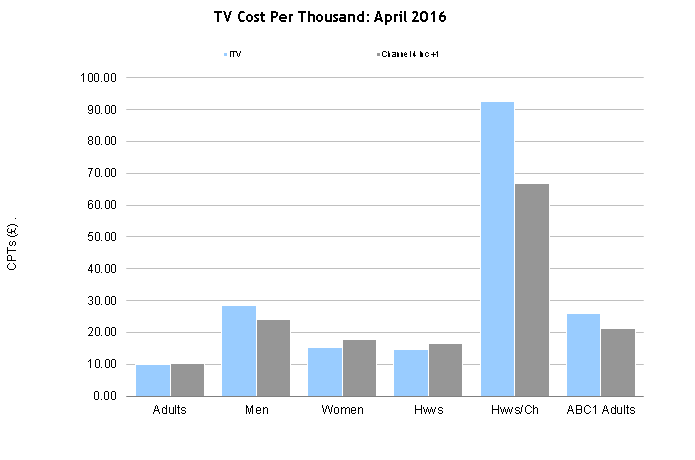
| ITV | 9.92 | 28.61 | 15.18 | 14.58 | 92.42 | 25.92 |
| % Ch YoY | -10.68 | -9.86 | -11.12 | -11.09 | -10.84 | -12.87 |
| Channel 4 inc +1 | 10.25 | 24.13 | 17.81 | 16.58 | 66.65 | 21.24 |
| % Ch YoY | -6.61 | -10.00 | -4.10 | -7.66 | -4.29 | -6.02 |
Commercial Impacts
| Impacts | Adults | Men | Women | Hwvs | Hwvs/Ch | ABC1 Adults |
|---|---|---|---|---|---|---|
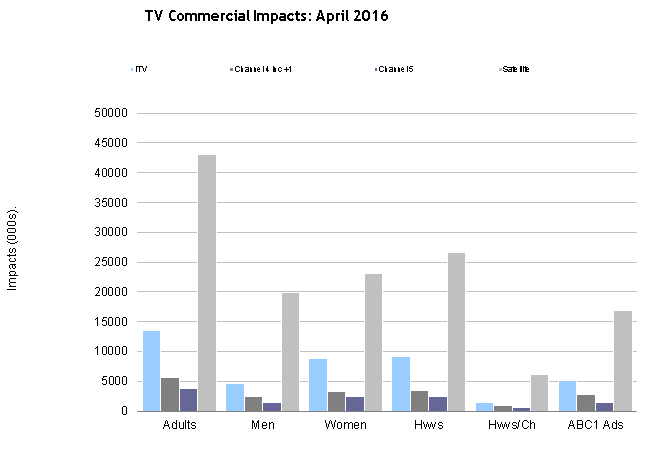
| ITV | 13,468.42 | 4,668.51 | 8,799.89 | 9,160.74 | 1,445.17 | 5,153.48 |
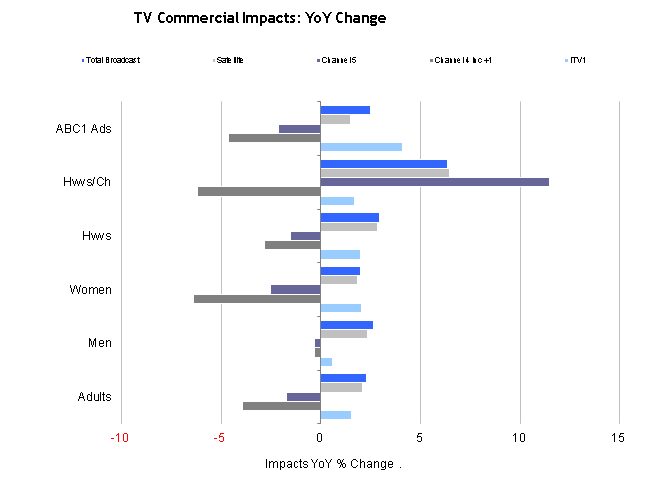
| % Ch YoY | 1.53 | 0.60 | 2.03 | 2.00 | 1.70 | 4.08 |
| Channel 4 inc +1 | 5,631.88 | 2,391.71 | 3,240.17 | 3,479.94 | 865.89 | 2,716.45 |
| % Ch YoY | -3.93 | -0.34 | -6.42 | -2.82 | -6.22 | -4.63 |
| Channel 5 | 3,817.18 | 1,440.59 | 2,376.59 | 2,376.59 | 562.08 | 1,439.23 |
| % Ch YoY | -1.73 | -0.34 | -2.55 | -1.55 | 11.47 | -2.14 |
| Satellite | 43,047.22 | 19,925.90 | 23,121.20 | 26,599.50 | 6,213.08 | 16,808.55 |
| % Ch YoY | 2.07 | 2.34 | 1.84 | 2.86 | 6.44 | 1.46 |
| Total Broadcast | 68,300.42 | 29,215.91 | 39,084.37 | 43,438.34 | 9,518.90 | 27,111.97 |
| % Ch YoY | 2.27 | 2.64 | 2.00 | 2.96 | 6.34 | 2.47 |