Commercial television channels saw their network revenue decline in August as the BBC dominated ratings around the London 2012 Olympics.
ITV1 saw its revenue dip -7.6% in the month, compared to August 2011, according to latest agency estimates.
Channel 4 took the biggest hit, down -18.1% YoY, despite its popular Paralympic coverage. Channel 5 saw an -8.3% decline, while ITV breakfast was down -10.6%.
Overall, Total Terrestrial (including ITV Breakfast) was down -10.7% YoY, while Total Satellite was down -0.6%.
Network Revenue
| Total Revenue | Aug 11 | Aug 12 | % Change |
|---|---|---|---|
| ITV1 | 74,210,000 | 68,570,000 | -7.6 |
| Channel 4 | 37,930,000 | 31,050,000 | -18.1 |
| Channel 5 | 18,780,000 | 17,230,000 | -8.3 |
| ITV Breakfast | 3,980,000 | 3,560,000 | -10.6 |
| Total Terrestrial (inc. ITV Breakfast) | 134,900,000 | 120,410,000 | -10.7 |
| Total Satellite | 87,860,000 | 87,310,000 | -0.6 |
Source: Agency Estimates
ITV Franchise Area
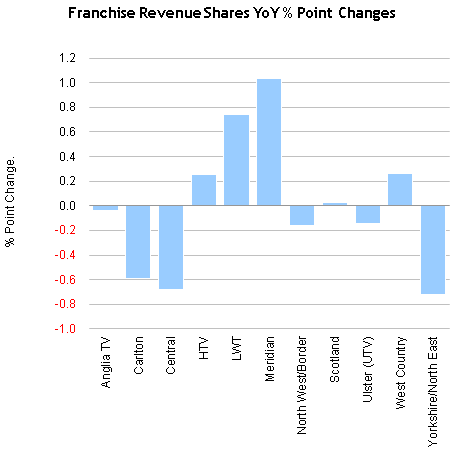
| % Share of ITV Revenue by Franchise | Jun 11 | Jun 12 | % Point Change |
|---|---|---|---|
| Anglia TV | 7.56 | 7.52 | -0.04 |
| Carlton | 14.01 | 13.42 | -0.59 |
| Central | 16.47 | 15.79 | -0.68 |
| HTV | 6.36 | 6.61 | 0.25 |
| LWT | 10.68 | 11.42 | 0.74 |
| Meridian | 10.22 | 11.25 | 1.03 |
| North West/Border | 11.08 | 10.92 | -0.16 |
| Scotland | 6.46 | 6.49 | 0.03 |
| Ulster (UTV) | 3.07 | 2.93 | -0.14 |
| West Country | 2.00 | 2.26 | 0.26 |
| Yorkshire/North East | 12.10 | 11.38 | -0.72 |
Network CPTs
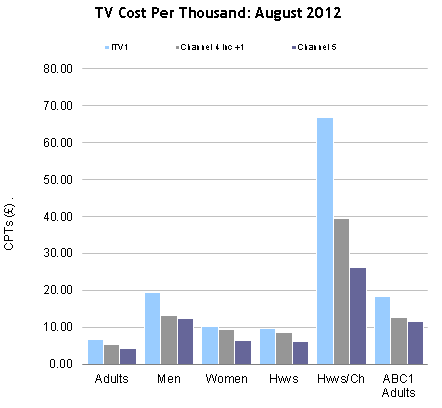
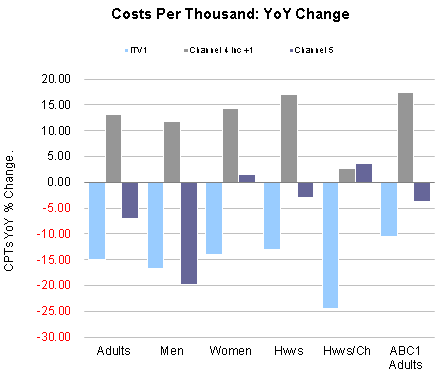
| CPTs | Adults | Men | Women | Hwvs | Hwvs/Ch | ABC1 Adults |
|---|---|---|---|---|---|---|
| ITV1 | 6.75 | 19.52 | 10.32 | 9.77 | 66.79 | 18.46 |
| % Ch YoY | -14.95 | -16.81 | -13.94 | -13.08 | -24.48 | -10.57 |
| Channel 4 inc +1 | 5.48 | 13.25 | 9.35 | 8.67 | 39.37 | 12.59 |
| % Ch YoY | 13.19 | 11.73 | 14.24 | 16.94 | 2.59 | 17.43 |
| Channel 5 | 4.28 | 12.52 | 6.50 | 6.21 | 26.07 | 11.70 |
| % Ch YoY | -6.95 | -19.82 | 1.51 | -3.01 | 3.67 | -3.73 |
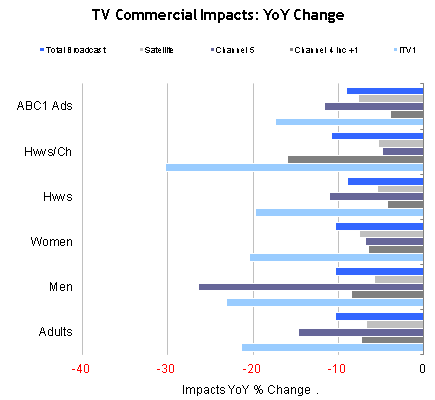
Commercial Impacts
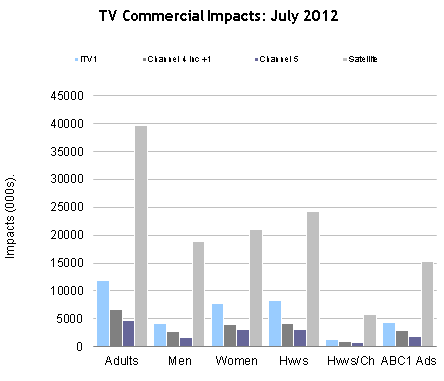
| Impacts | Adults | Men | Women | Hwvs | Hwvs/Ch | ABC1 Adults |
|---|---|---|---|---|---|---|
| ITV1 | 11,949.11 | 4,132.39 | 7,816.68 | 8,254.22 | 1,207.88 | 4,371.01 |
| % Ch YoY | -21.41 | -23.13 | -20.47 | -19.68 | -30.22 | -17.36 |
| Channel 4 inc +1 | 6,664.02 | 2,757.60 | 3,906.42 | 4,214.47 | 927.76 | 2,901.79 |
| % Ch YoY | -7.34 | -8.53 | -6.48 | -4.27 | -16.02 | -3.87 |
| Channel 5 | 4,737.26 | 1,619.56 | 3,117.71 | 3,117.71 | 777.42 | 1,732.67 |
| % Ch YoY | -14.63 | -26.44 | -6.86 | -11.01 | -4.88 | -11.67 |
| Satellite | 39,783.12 | 18,808.31 | 20,974.88 | 24,241.68 | 5,760.96 | 15,242.59 |
| % Ch YoY | -6.73 | -5.77 | -7.58 | -5.48 | -5.35 | -7.65 |
| Total Broadcast | 63,874.02 | 27,501.75 | 36,372.31 | 40,575.58 | 8,773.79 | 24,533.81 |
| % Ch YoY | -10.34 | -10.33 | -10.34 | -8.93 | -10.84 | -9.08 |
TV market data is available in
mediatel.co.uk’s TV Database.