

The latest TV Market round-up figures for August reveal a significant dip in total satellite revenue, down -0.8% compared with July’s 15.5% rise, while other channels fared much better.
ITV1 saw the greatest yearly revenue lift, up 25.6% to just over £86 million followed by Channel 5, up 21.6%.
Channel 4 and ITV Breakfast also celebrated healthy yearly gains, up 13.1% and 12.9%, respectively, with total terrestrial television surpassing July’s results to reach a total yearly revenue of £146.2 million (up 21.4%).
Network Revenue
| Total Revenue | Aug 12 | Aug 13 | % Change |
|---|---|---|---|
| ITV1 | 68,570,000 | 86,100,000 | 25.6 |
| Channel 4 | 31,050,000 | 35,110,000 | 13.1 |
| Channel 5 | 17,230,000 | 20,950,000 | 21.6 |
| ITV Breakfast | 3,560,000 | 4,020,000 | 12.9 |
| Total Terrestrial (inc. ITV Breakfast) | 120,410,000 | 146,180,000 | 21.4 |
| Total Satellite | 87,310,000 | 86,600,000 | -0.8 |
Source: Agency Estimates
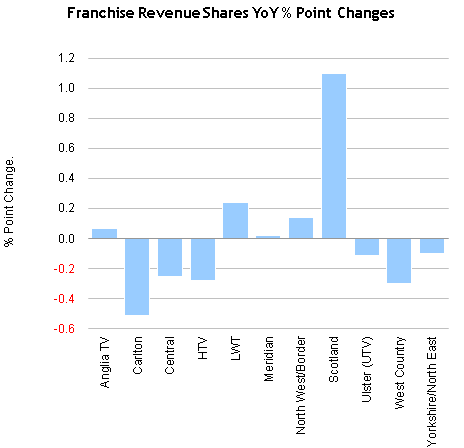
ITV Franchise Area
| % Share of ITV Revenue by Franchise | Aug 12 | Aug 13 | % Point Change |
|---|---|---|---|
| Anglia TV | 7.52 | 7.59 | 0.07 |
| Carlton | 13.42 | 12.91 | -0.51 |
| Central | 15.79 | 15.54 | -0.25 |
| HTV | 6.61 | 6.33 | -0.28 |
| LWT | 11.42 | 11.66 | 0.24 |
| Meridian | 11.25 | 11.27 | 0.02 |
| North West/Border | 10.92 | 11.06 | 0.14 |
| Scotland | 6.49 | 7.59 | 1.10 |
| Ulster (UTV) | 2.93 | 2.82 | -0.11 |
| West Country | 2.26 | 1.96 | -0.30 |
| Yorkshire/North East | 11.38 | 11.28 | -0.10 |
Network CPTs
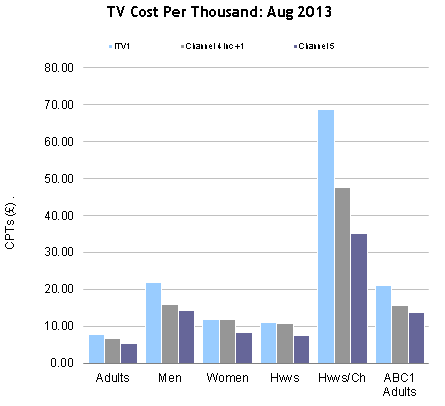
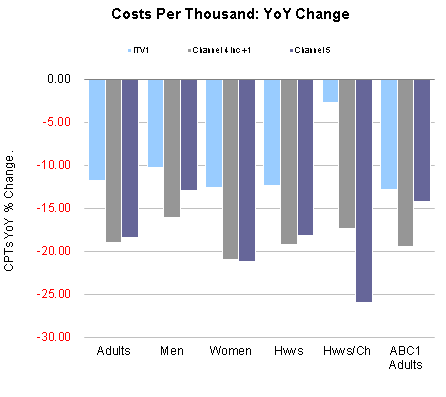
| CPTs | Adults | Men | Women | Hwvs | Hwvs/Ch | ABC1 Adults |
|---|---|---|---|---|---|---|
| ITV1 | 7.65 | 21.75 | 11.81 | 11.16 | 68.68 | 21.17 |
| % Ch YoY | -11.78 | -10.26 | -12.58 | -12.43 | -2.76 | -12.82 |
| Channel 4 inc +1 | 6.76 | 15.78 | 11.84 | 10.74 | 47.68 | 15.64 |
| % Ch YoY | -18.96 | -16.06 | -21.00 | -19.26 | -17.42 | -19.52 |
| Channel 5 | 5.24 | 14.38 | 8.25 | 7.59 | 35.22 | 13.64 |
| % Ch YoY | -18.39 | -12.97 | -21.21 | -18.21 | -25.97 | -14.24 |
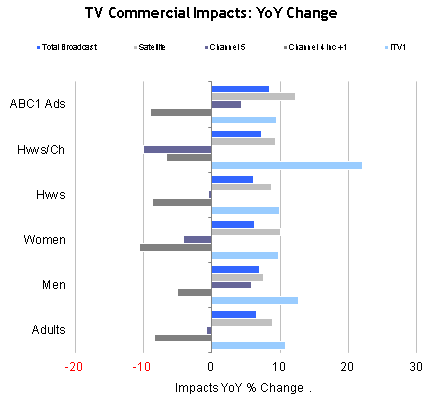
Commercial Impacts
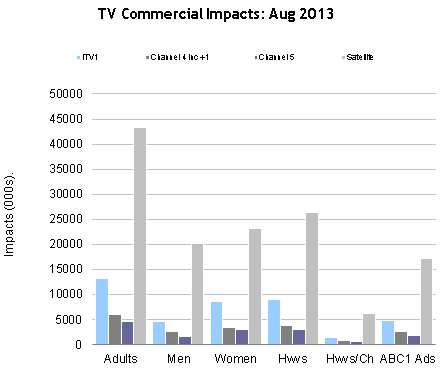
| Impacts | Adults | Men | Women | Hwvs | Hwvs/Ch | ABC1 Adults |
|---|---|---|---|---|---|---|
| ITV1 | 13,236.84 | 4,656.52 | 8,580.30 | 9,076.37 | 1,474.81 | 4,784.57 |
| % Ch YoY | 10.77 | 12.68 | 9.76 | 9.96 | 22.09 | 9.46 |
| Channel 4 inc +1 | 6,106.99 | 2,617.30 | 3,489.70 | 3,847.51 | 866.35 | 2,640.87 |
| % Ch YoY | -8.35 | -5.08 | -10.66 | -8.70 | -6.61 | -8.99 |
| Channel 5 | 4,700.72 | 1,713.91 | 2,986.81 | 2,986.81 | 699.76 | 1,806.83 |
| % Ch YoY | -0.77 | 5.82 | -4.19 | -0.55 | -9.98 | 4.27 |
| Satellite | 43,291.53 | 20,218.12 | 23,073.24 | 26,347.36 | 6,293.39 | 17,114.63 |
| % Ch YoY | 8.81 | 7.48 | 9.99 | 8.68 | 9.23 | 12.27 |
| Total Broadcast | 68,062.13 | 29,423.31 | 38,638.62 | 43,062.82 | 9,409.61 | 26,620.80 |
| % Ch YoY | 6.55 | 6.98 | 6.22 | 6.12 | 7.24 | 8.49 |
TV market data is available in
mediatel.co.uk’s TV Database.