ITV1 enjoyed a 3.6% increase in network revenue for May, according to latest agency estimates. It was the only broadcaster in our analysis to record a rise, with Channel 4, Channel 5 and ITV Breakfast all posting year on year declines.
ITV1’s Britain’s Got Talent dominated the TV ratings during the month, with the final episode banking 12.6 million viewers as Pudsey the dancing dog went walkies with a £500,000 cash prize.
Chelsea’s penalty victory in the final of the UEFA Champions League over Bayern Munich also secured over 6.9 million viewers for ITV1.
Channel 5 recorded the biggest drop in revenue during May, down -5.7%, however it will be looking for a boost in May with the arrival of the new Big Brother series. Channel 4, meanwhile, suffered a -5.3% fall year on year during the month. ITV Breakfast saw revenues dip -2.4% compared with May 2011.
Overall, Total Terrestrial (including ITV Breakfast) was down -0.1 YoY, while Total Satellite was up 18.1%.
Network Revenue
| Total Revenue | May 11 | May 12 | % Change |
|---|---|---|---|
| ITV1 | 112,740,000 | 116,830,000 | 3.6 |
| Channel 4 | 51,750,000 | 49,030,000 | -5.3 |
| Channel 5 | 24,550,000 | 23,150,000 | -5.7 |
| ITV Breakfast | 4,580,000 | 4,470,000 | -2.4 |
| Total Terrestrial (inc. ITV Breakfast) | 193,620,000 | 193,480,000 | -0.1 |
| Total Satellite | 115,220,000 | 136,110,000 | 18.1 |
Source: Agency Estimates
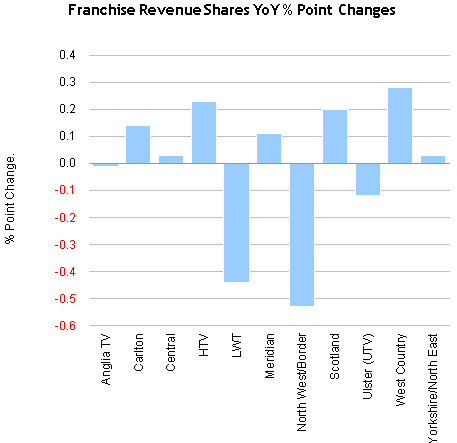
ITV Franchise Area
| % Share of ITV Revenue by Franchise | May 11 | May 12 | % Point Change |
|---|---|---|---|
| Anglia TV | 7.88 | 7.87 | -0.01 |
| Carlton | 13.16 | 13.30 | 0.14 |
| Central | 15.79 | 15.82 | 0.03 |
| HTV | 6.37 | 6.60 | 0.23 |
| LWT | 12.94 | 12.50 | -0.44 |
| Meridian | 11.87 | 11.98 | 0.11 |
| North West/Border | 10.65 | 10.12 | -0.53 |
| Scotland | 6.13 | 6.33 | 0.20 |
| Ulster (UTV) | 2.69 | 2.57 | -0.12 |
| West Country | 1.95 | 2.23 | 0.28 |
| Yorkshire/North East | 10.65 | 10.68 | 0.03 |
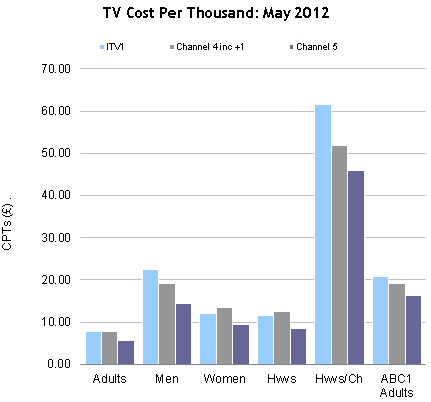
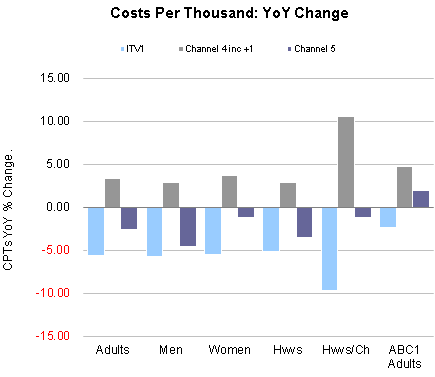
Network CPTs
| CPTs | Adults | Men | Women | Hwvs | Hwvs/Ch | ABC1 Adults |
|---|---|---|---|---|---|---|
| ITV1 | 7.83 | 22.48 | 12.01 | 11.55 | 61.63 | 20.75 |
| % Ch YoY | -5.61 | -5.79 | -5.51 | -5.17 | -9.70 | -2.36 |
| Channel 4 inc +1 | 7.86 | 19.12 | 13.35 | 12.49 | 51.91 | 19.03 |
| % Ch YoY | 3.31 | 2.85 | 3.64 | 2.82 | 10.47 | 4.65 |
| Channel 5 | 5.74 | 14.45 | 9.53 | 8.50 | 45.97 | 16.28 |
| % Ch YoY | -2.58 | -4.54 | -1.24 | -3.57 | -1.25 | 1.97 |
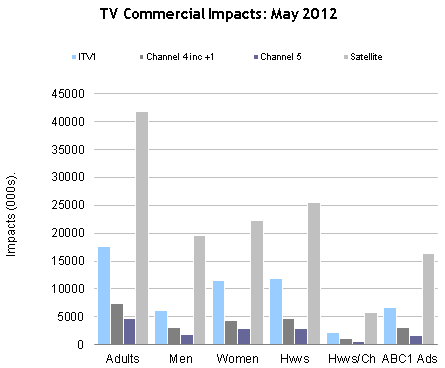
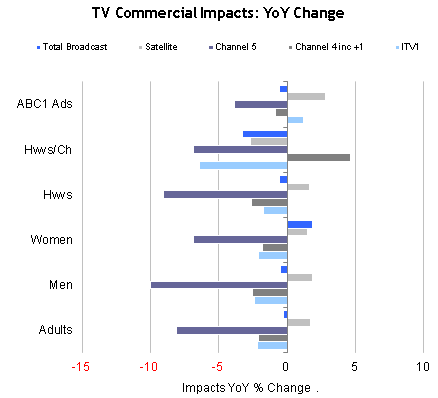
Commercial Impacts
| Impacts | Adults | Men | Women | Hwvs | Hwvs/Ch | ABC1 Adults |
|---|---|---|---|---|---|---|
| ITV1 | 17,554.42 | 6,113.32 | 11,441.11 | 11,900.82 | 2,230.21 | 6,623.46 |
| % Ch YoY | -2.18 | -2.37 | -2.08 | -1.72 | -6.42 | 1.17 |
| Channel 4 inc +1 | 7,338.73 | 3,016.86 | 4,321.86 | 4,617.59 | 1,111.17 | 3,031.20 |
| % Ch YoY | -2.11 | -2.55 | -1.80 | -2.58 | 4.66 | -0.84 |
| Channel 5 | 4,742.55 | 1,884.90 | 2,857.62 | 2,857.62 | 592.51 | 1,673.03 |
| % Ch YoY | -8.13 | -9.98 | -6.87 | -9.06 | -6.87 | -3.84 |
| Satellite | 41,872.67 | 19,502.58 | 22,370.15 | 25,435.01 | 5,846.17 | 16,364.87 |
| % Ch YoY | 1.67 | 1.87 | 1.51 | 1.59 | -2.71 | 2.83 |
| Total Broadcast | 28,187.30 | 45,949.37 | 9,985.63 | 30,857.45 | 41,716.35 | 72,573.72 |
| % Ch YoY | -0.29 | -0.46 | 1.87 | -0.54 | -3.28 | -0.59 |