An overall analysis of RAJAR figures released for the first quarter of this year show that while the BBC enjoys a slight lead in terms of share, commercial and non-commercial radio remain neck and neck when it comes to reach. Encouraging news for both sides, though, is the fact that, year on year, reach for All Radio is up 2.3%, and average hours per listener 3.4%.
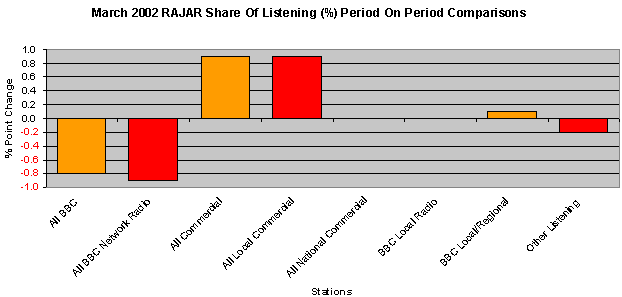
Period on period analysis shows that, in terms of share while All BBC radio saw a drop of 0.8 percentage points, with 52.6% it retained a higher share of listening than All Commercial, which rose 0.9 percentage points to 45.5%.
In a breakdown of those results, All BBC Network saw a 0.9 percentage point drop period on period to a 41.1% share. Meanwhile Local Commercial saw its share increase by 0.9 percentage points during the same period, to 37.7%, but National Commercial remained at 7.8% share.
| March 2002 RAJAR Share Of Listening Comparisons | ||||
| Station | Survey Period | Ending Dec 2001 | Ending Mar 2002 | % Point Change |
| All BBC | Q | 53.4 | 52.6 | -0.8 |
| All BBC Network Radio | Q | 42.0 | 41.1 | -0.9 |
| All Commercial | Q | 44.6 | 45.5 | 0.9 |
| All Local Commercial | Q | 36.8 | 37.7 | 0.9 |
| All National Commercial | Q | 7.8 | 7.8 | 0.0 |
| BBC Local Radio | Q | 11.2 | 11.2 | 0.0 |
| BBC Local/Regional | Q | 11.3 | 11.4 | 0.1 |
| Other Listening | Q | 2.1 | 1.9 | -0.2 |
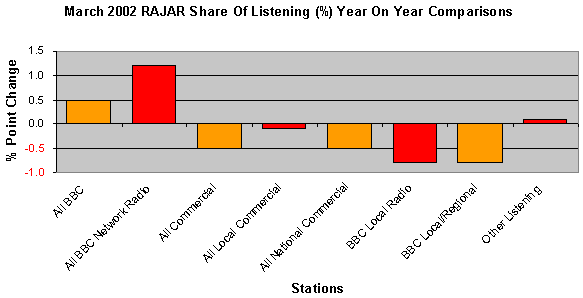
Year on year the analysis of audience share favoured the BBC more, as All BBC saw a 0.5 percentage point rise, compared to a drop of same proportion for All Commercial and National Commercial. However, both BBC Local and BBC Local/Regional audience share figures saw a 0.8 percentage point drop year on year.
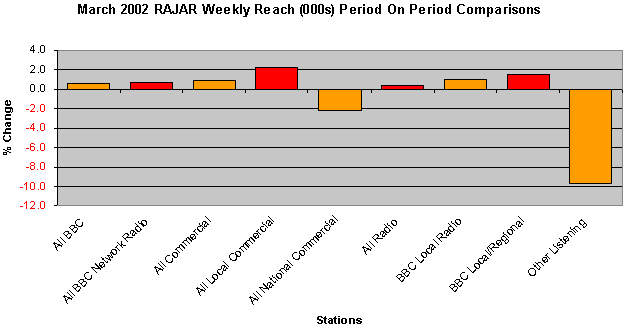
Period on period, the weekly reach of All Radio saw an increase of 0.3% to 44.35 million. Within this All Commercial saw a 0.9% increase to 32.2 million, only a shade behind All BBC, which added 0.5% to reach 32.9 million.
Within the commercial radio figures, gains in Local Commercial reach, of 2.2% 27.4 million, were offset by losses in National Commercial, also of 2.2%, to 11 million.
| March 2002 RAJAR Weekly Reach (000s) Comparisons | ||||
| Station | Survey Period | Ending Dec 2001 | Ending Mar 2002 | % Change |
| All BBC | Q | 32,674 | 32,850 | 0.5 |
| All BBC Network Radio | Q | 28,538 | 28,728 | 0.7 |
| All Commercial | Q | 31,877 | 32,155 | 0.9 |
| All Local Commercial | Q | 26,865 | 27,448 | 2.2 |
| All National Commercial | Q | 11,330 | 11,085 | -2.2 |
| All Radio | Q | 44,218 | 44,350 | 0.3 |
| BBC Local Radio | Q | 8,341 | 8,421 | 1.0 |
| BBC Local/Regional | Q | 10,712 | 10,865 | 1.4 |
| Other Listening | Q | 3,021 | 2,728 | -9.7 |
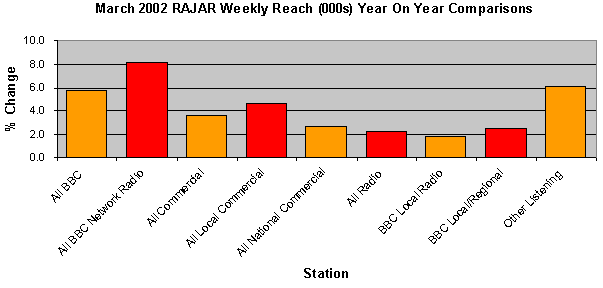
Year on year, there was an even more healthy story for reach across All Radio, up 2.3%. All BBC was up 5.8%, while All Commercial saw a 3.6% increase. Within those figures Local Commercial saw a 4.6% increase and BBC Network an 8.2% increase.
Average hours per listener across all radio were up 3.4% year on year to 24.6% during the first period of this year. This meant encouraging news for both commercial and non-commercial radio. All Commercial saw a 0.7% increase in its listener hours, to 15.0, while All BBC went up 0.6% to 17.4. However, average hours per listener were down for Commercial Radio, by 2.5% to 7.7 and also for BBC Local radio stations, by 4.8% to 11.8.
| March 2002 RAJAR Average Hours Per Listener Comparisons | ||||
| Station | Survey Period | Ending Mar 2001 | Ending Mar 2002 | % Change |
| All BBC | Q | 17.3 | 17.4 | 0.6 |
| All BBC Network Radio | Q | 15.5 | 15.6 | 0.6 |
| All Commercial | Q | 15.3 | 15.4 | 0.7 |
| All Local Commercial | Q | 14.9 | 15.0 | 0.7 |
| All National Commercial | Q | 7.9 | 7.7 | -2.5 |
| All Radio | Q | 23.8 | 24.6 | 3.4 |
| BBC Local Radio | Q | 12.4 | 11.8 | -4.8 |
| BBC Local/Regional | Q | 11.9 | 11.5 | -3.4 |
| Other Listening | Q | 7.4 | 7.6 | 2.7 |
Subscribers can access the Radio database by selecting “Radio” from the drop-down box at the top of this page.