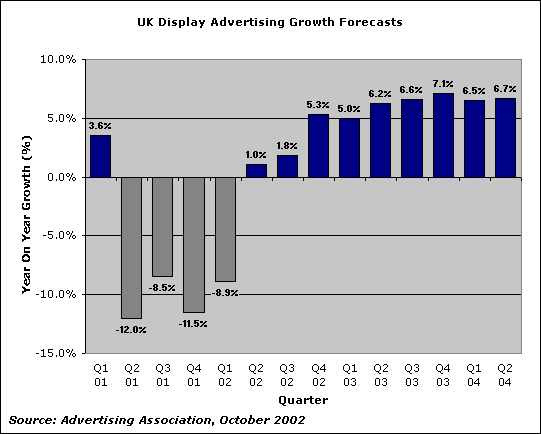
UK display advertising is set to grow by 1.8% in Q3 this year, after which growth should steadily, if not dramatically, rise. This is according to the latest set of forecasts from the Advertising Association (AA).
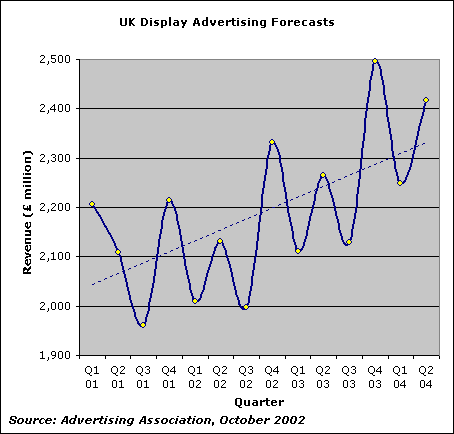
The figures show increases in quarterly growth throughout 2003, followed by a gentle dip moving into 2004. Throughout the period, gross adspend is gradually on the rise, as indicated in the chart’s trend line.
| UK Display Advertising Forecasts | ||
| Display Revenue (£m) | Growth (%) | |
| Q1 01 | 2,206 | 3.6% |
| Q2 01 | 2,109 | -12.0% |
| Q3 01 | 1,961 | -8.5% |
| Q4 01 | 2,214 | -11.5% |
| Q1 02 | 2,010 | -8.9% |
| Q2 02 | 2,131 | 1.0% |
| Q3 02 | 1,997 | 1.8% |
| Q4 02 | 2,331 | 5.3% |
| Q1 03 | 2,111 | 5.0% |
| Q2 03 | 2,264 | 6.2% |
| Q3 03 | 2,129 | 6.6% |
| Q4 03 | 2,496 | 7.1% |
| Q1 04 | 2,249 | 6.5% |
| Q2 04 | 2,416 | 6.7% |
| Source: Advertising Association, October 2002 | ||
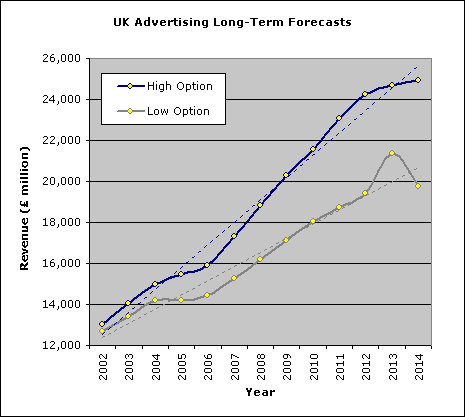
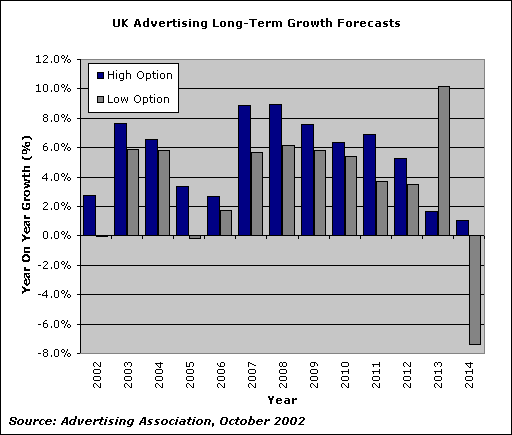
Long-term forecasts The Association’s long-term forecasts predict a peak in growth in 2008, after which the rate of growth is expected to begin to dip. The AA has produced both a high (optimistic) and low (pessimistic) option in its data.
| Long Term Total UK Advertising Forecasts | ||||
| High Option | Low Option | |||
| Revenue (£m) | Growth (%) | Revenue (£m) | Growth (%) | |
| 2001 | 12,696 | -5.3% | 12,696 | -5.3% |
| 2002 | 13,046 | 2.8% | 12,690 | 0.0% |
| 2003 | 14,045 | 7.7% | 13,437 | 5.9% |
| 2004 | 14,970 | 6.6% | 14,215 | 5.8% |
| 2005 | 15,472 | 3.4% | 14,188 | -0.2% |
| 2006 | 15,888 | 2.7% | 14,432 | 1.7% |
| 2007 | 17,297 | 8.9% | 15,254 | 5.7% |
| 2008 | 18,846 | 9.0% | 16,194 | 6.2% |
| 2009 | 20,278 | 7.6% | 17,136 | 5.8% |
| 2010 | 21,564 | 6.3% | 18,067 | 5.4% |
| 2011 | 23,049 | 6.9% | 18,736 | 3.7% |
| 2012 | 24,260 | 5.3% | 19,393 | 3.5% |
| 2013 | 24,664 | 1.7% | 21,360 | 10.1% |
| 2014 | 24,924 | 1.1% | 19,778 | -7.4% |
| Source: Advertising Association, October 2002 | ||||