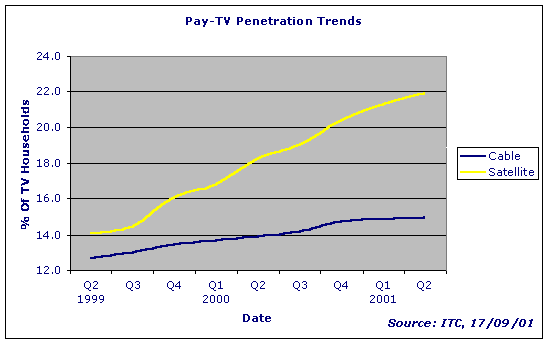
The latest figures from the Independent Television Commission (ITC) show the shifting positions of the cable and satellite markets in the pay-TV sector.
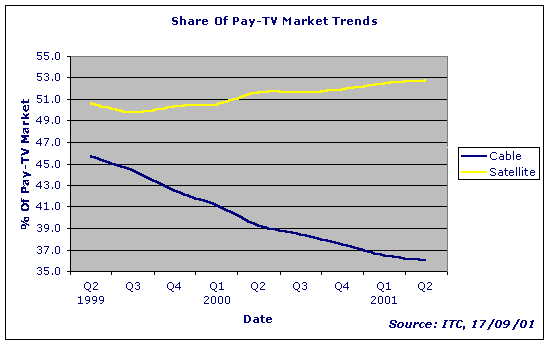
Trends since 1999 show how cable’s penetration of all UK TV households has started to flatten off, whilst satellite’s continues to grow. The dynamics of this are illustrated clearly by the second graph here which charts cable’s falling share of households within the pay-TV market, whilst satellite’s share remains fairly steady.
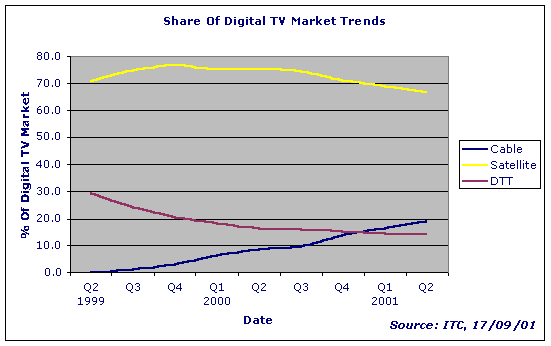
The final graph shows how cable overtook terrestrial in the digital market round about the beginning of this year. This is bad news for the troubled DTT operator, ITV digital (see Forecasts)
| Cable Industry’s Position In The Marketplace | |||||||||
| 1999 | 2000 | 2001 | |||||||
| Q2 | Q3 | Q4 | Q1 | Q2 | Q3 | Q4 | Q1 | Q2 | |
| Pay TV Penetration – % TV Households | |||||||||
| Cable | 12.7 | 13.0 | 13.5 | 13.7 | 13.9 | 14.2 | 14.8 | 14.9 | 15.0 |
| Satellite | 14.1 | 14.5 | 16.1 | 16.8 | 18.3 | 19.1 | 20.4 | 21.3 | 21.9 |
| DTT | 1.0 | 1.7 | 2.3 | 2.8 | 3.2 | 3.6 | 4.2 | 4.5 | 4.7 |
| Total | 27.8 | 29.2 | 31.9 | 33.3 | 35.4 | 37.0 | 39.4 | 40.7 | 41.5 |
| Digital Penetration – % TV Households | |||||||||
| Cable | 0.0 | 0.1 | 0.4 | 1.0 | 1.7 | 2.2 | 3.7 | 5.0 | 6.2 |
| Satellite | 2.5 | 5.3 | 8.6 | 11.5 | 14.9 | 17.0 | 19.4 | 20.8 | 21.8 |
| DTT | 1.0 | 1.7 | 2.3 | 2.8 | 3.2 | 3.6 | 4.2 | 4.5 | 4.7 |
| Total | 3.5 | 7.1 | 11.3 | 15.3 | 19.8 | 22.8 | 27.3 | 30.3 | 32.7 |
| Share of Pay TV Market – % | |||||||||
| Cable | 45.7 | 44.4 | 42.5 | 41.1 | 39.3 | 38.5 | 37.5 | 36.5 | 36.0 |
| Satellite | 50.6 | 49.7 | 50.3 | 50.5 | 51.6 | 51.6 | 51.9 | 52.5 | 52.7 |
| DTT | 3.7 | 5.9 | 7.2 | 8.4 | 9.1 | 9.9 | 10.6 | 11.0 | 11.2 |
| Share of Digital TV Market – % | |||||||||
| Cable | 0.0 | 1.1 | 3.1 | 6.5 | 8.5 | 9.7 | 13.7 | 16.6 | 19.1 |
| Satellite | 70.8 | 74.8 | 76.5 | 75.1 | 75.3 | 74.4 | 70.9 | 68.7 | 66.7 |
| DTT | 29.2 | 24.0 | 20.4 | 18.4 | 16.3 | 16.0 | 15.4 | 14.7 | 14.3 |
| Share of Net Additions – % | |||||||||
| Cable | 26.6 | 21.0 | 21.8 | 10.4 | 12.6 | 21.1 | 22.1 | 13.1 | 13.5 |
| Satellite | 7.0 | 33.1 | 56.7 | 54.6 | 68.1 | 52.8 | 55.3 | 67.0 | 65.5 |
| DTT | 66.3 | 45.9 | 21.5 | 35.0 | 19.3 | 26.1 | 22.6 | 19.9 | 21.0 |
| Source: Independent Television Commission, 17/09/01 | |||||||||