
The latest RAJAR figures for Q2 2012 show that All Radio’s reach has dropped slightly compared with the same period last year, keeping it just below the 47 million listener mark, which it hit for the first time ever in Q1 2011. However, All Radio’s reach is up 0.2% QoQ.
All Radio’s figures peaked this time last year (Q2 2011), hitting a high of 47.6 million, though it fell to 47.1 million in Q3 and 46.7 million in Q4. In the first three months of this year, All Radio remained static at 46.7 million listeners. In Q2, this figure increase slightly to 46.8 million listeners.
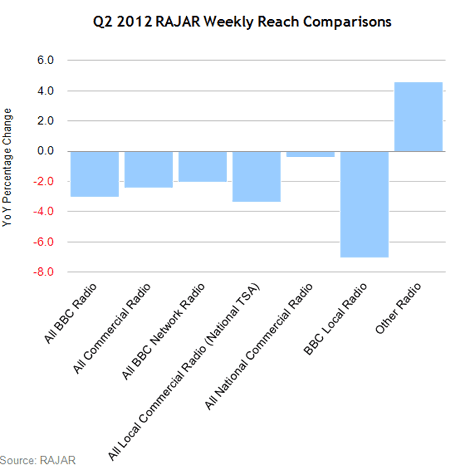
All Commercial Radio saw a small -0.1% QoQ dip, closing the gap on All BBC, which recorded a bigger drop in reach – down -0.4% QoQ and -3.1% YoY. Following talk of cuts, BBC Local Radio suffered a substantial -9.4% QoQ decline in reach this quarter.
Weekly Reach
Q2 2012 was a positive period for national commercial radio, with All National Commercial Radio’s total reach up to more than 16.1 million listeners following a 1.3% QoQ rise. All BBC Network Radio also enjoyed a 0.8% QoQ increase in reach.
However, All Local Commercial Radio (National TSA) posted a small -0.6% dip during the quarter (down -3.4% YoY), while BBC Local Radio suffered a hefty fall of -9.4% QoQ (and -7.1% YoY), taking its total reach below nine million – its lowest figure since Q4 2009. At the start of last year, BBC Local Radio’s reach was 10.2 million.
This follows the BBC’s decision to drop controversial plans to share afternoon shows between its local radio stations, with the total amount of cuts halved to £8 million a year from the originally proposed £15 million.
The BBC’s total reach now stands at 34.4 million, while All Commercial’s reach sits at 33.2 million.
| Ending Jun 11 | Ending Sep 11 | Ending Dec 11 | Ending Mar 12 | Ending Jun 12 | QoQ % Change Mar 12 vs Jun 12 | YoY % Change Jun 11 vs Jun 12 | |
|---|---|---|---|---|---|---|---|
| All Radio | 47,616 | 47,137 | 46,677 | 46,676 | 46,782 | 0.2 | -1.8 |
| All BBC Radio | 35,530 | 34,863 | 34,940 | 34,594 | 34,444 | -0.4 | -3.1 |
| All Commercial Radio | 34,021 | 33,719 | 32,821 | 33,201 | 33,182 | -0.1 | -2.5 |
| All BBC Network Radio | 32,108 | 31,723 | 31,635 | 31,196 | 31,454 | 0.8 | -2.0 |
| All Local Commercial Radio (National TSA) | 27,289 | 27,036 | 26,275 | 26,533 | 26,364 | -0.6 | -3.4 |
| All National Commercial Radio | 16,166 | 15,573 | 15,441 | 15,896 | 16,101 | 1.3 | -0.4 |
| BBC Local Radio | 9,645 | 9,499 | 9,604 | 9,895 | 8,962 | -9.4 | -7.1 |
| Other Radio | 3,238 | 3,062 | 2,937 | 3,135 | 3,387 | 8.0 | 4.6 |
Source: RAJAR
Share of Listening
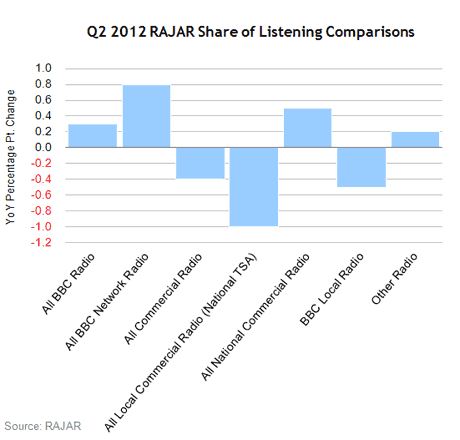
Commercial radio saw its share of listening rise 1.0% in the quarter. All Local Commercial Radio (National TSA) and All National Commercial Radio enjoyed an increase in share during Q2 – up 0.2% and 0.7% QoQ respectively.
All BBC Radio, meanwhile, recorded a -1.1% QoQ fall but enjoyed a 0.3% YoY increase. BBC Local Radio also posted a -1.3% QoQ drop in share, though BBC Network Radio enjoyed a small 0.3% increase.
All Commercial Radio now has a 43.3% share compared to the BBC’s 54.3% share.
| Ending Jun 11 | Ending Sep 11 | Ending Dec 11 | Ending Mar 12 | Ending Jun 12 | QoQ % Point Change Mar 12 vs Jun 12 | YoY % Point Change Jun 11 vs Jun 12 | |
|---|---|---|---|---|---|---|---|
| All Radio | 100.0 | 100.0 | 100.0 | 100.0 | 100.0 | n/a | n/a |
| All BBC Radio | 54.0 | 54.5 | 55.5 | 55.4 | 54.3 | -1.1 | 0.3 |
| All BBC Network Radio | 45.4 | 46.1 | 46.6 | 45.9 | 46.2 | 0.3 | 0.8 |
| All Commercial Radio | 43.7 | 43.3 | 42.4 | 42.3 | 43.3 | 1.0 | -0.4 |
| All Local Commercial Radio (National TSA) | 31.5 | 31.8 | 30.6 | 30.3 | 30.5 | 0.2 | -1.0 |
| All National Commercial Radio | 12.2 | 11.5 | 11.8 | 12.0 | 12.7 | 0.7 | 0.5 |
| BBC Local Radio | 8.6 | 8.3 | 8.9 | 9.4 | 8.1 | -1.3 | -0.5 |
| Other Radio | 2.3 | 2.2 | 2.1 | 2.4 | 2.5 | 0.1 | 0.2 |
Source: RAJAR
Average Hours Per Listener
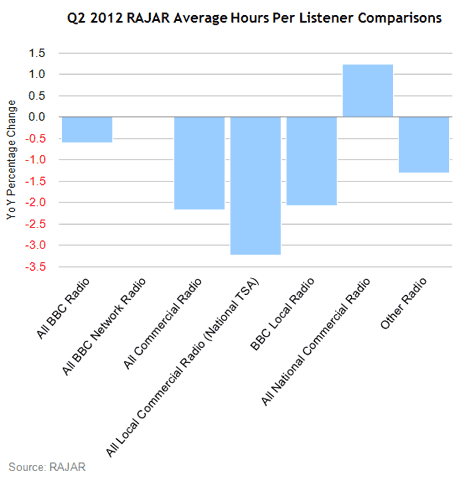
All Radio’s average hours fell during quarter two – down -3.1% QoQ and -2.2% YoY to 22.1 per week.
All BBC Radio and All Commercial Radio were down by -4.1% and -0.7% QoQ respectively.
| Ending Jun 11 | Ending Sep 11 | Ending Dec 11 | Ending Mar 12 | Ending Jun 12 | QoQ % Change Mar 12 vs Jun 12 | YoY % Change Jun 11 vs Jun 12 | |
|---|---|---|---|---|---|---|---|
| All Radio | 22.6 | 22.8 | 22.1 | 22.8 | 22.1 | -3.1 | -2.2 |
| All BBC Radio | 16.4 | 16.8 | 16.4 | 17.0 | 16.3 | -4.1 | -0.6 |
| All BBC Network Radio | 15.2 | 15.6 | 15.2 | 15.7 | 15.2 | -3.2 | 0 |
| All Commercial Radio | 13.8 | 13.8 | 13.3 | 13.6 | 13.5 | -0.7 | -2.2 |
| All Local Commercial Radio (National TSA) | 12.4 | 12.7 | 12.0 | 12.1 | 12.0 | -0.8 | -3.2 |
| BBC Local Radio | 9.6 | 9.4 | 9.6 | 10.1 | 9.4 | -6.9 | -2.1 |
| All National Commercial Radio | 8.1 | 7.9 | 7.9 | 8.1 | 8.2 | 1.2 | 1.2 |
| Other Radio | 7.6 | 7.8 | 7.5 | 8.0 | 7.5 | -6.3 | -1.3 |
Source: RAJAR

MediaTel has PowerPoint presentations available to download, featuring pre-prepared market breakdown graphs for the RAJAR data release – click here.