In contrast to June’s figures, commercial television channels in July 2013 saw an overall rise in yearly revenues, with Total Terrestrial up 12.1% to £145,200,000.
ITV1 recorded the highest yearly revenue at almost £84 million, up 14.3% year on year, while ITV Breakfast was down -2.5% – the only channel to experience a decline.
Channel 5 was up 14% to over £20.5 million, and Channel 4 was up 8.2% to over £37.3 million.
Total Satellite experienced a 15.5% boost in July’s yearly revenues, recording a figure just short of £98 million.
Network Revenue
| Total Revenue | Jul 12 | Jul 13 | % Change |
|---|---|---|---|
| ITV1 | 73,240,000 | 83,700,000 | 14.3 |
| Channel 4 | 34,500,000 | 37,320,000 | 8.2 |
| Channel 5 | 18,090,000 | 20,620,000 | 14.0 |
| ITV Breakfast | 3,650,000 | 3,560,000 | -2.5 |
| Total Terrestrial (inc. ITV Breakfast) | 129,480,000 | 145,200,000 | 12.1 |
| Total Satellite | 84,610,000 | 97,740,000 | 15.5 |
Source: Agency Estimates
ITV Franchise Area
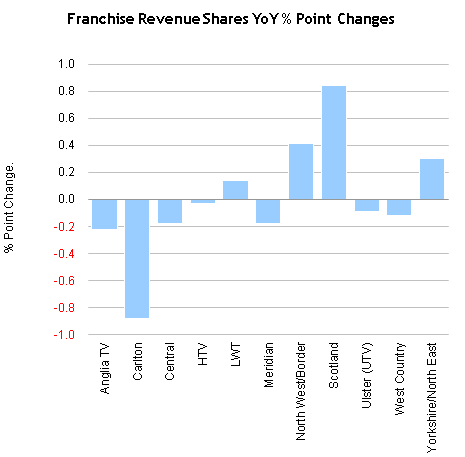
| % Share of ITV Revenue by Franchise | Jul 12 | Jul 13 | % Point Change |
|---|---|---|---|
| Anglia TV | 7.86 | 7.64 | -0.22 |
| Carlton | 14.01 | 13.13 | -0.88 |
| Central | 15.42 | 15.24 | -0.18 |
| HTV | 6.44 | 6.41 | -0.03 |
| LWT | 11.52 | 11.66 | 0.14 |
| Meridian | 11.82 | 11.64 | -0.18 |
| North West/Border | 10.63 | 11.04 | 0.41 |
| Scotland | 6.53 | 7.37 | 0.84 |
| Ulster (UTV) | 2.60 | 2.51 | -0.09 |
| West Country | 2.14 | 2.02 | -0.12 |
| Yorkshire/North East | 11.04 | 11.34 | 0.30 |
Network CPTs
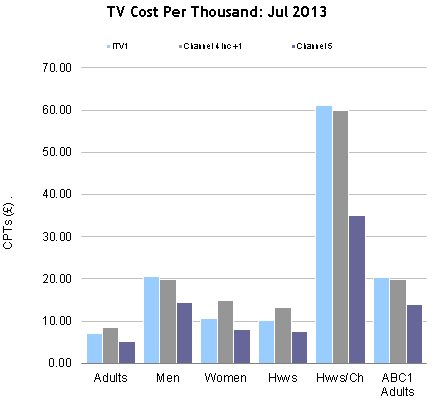
| CPTs | Adults | Men | Women | Hwvs | Hwvs/Ch | ABC1 Adults |
|---|---|---|---|---|---|---|
| ITV1 | 6.97 | 20.47 | 10.56 | 10.03 | 61.07 | 20.38 |
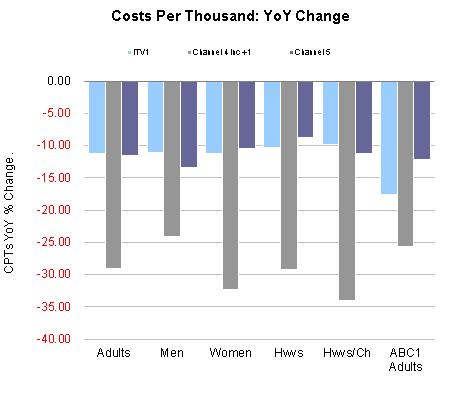
| % Ch YoY | -11.20 | -11.14 | -11.23 | -10.34 | -9.77 | -17.58 |
| Channel 4 inc +1 | 8.44 | 19.73 | 14.76 | 13.25 | 59.85 | 19.83 |
| % Ch YoY | -29.08 | -24.18 | -32.35 | -29.21 | -34.05 | -25.72 |
| Channel 5 | 5.19 | 14.49 | 8.09 | 7.42 | 34.94 | 14.01 |
| % Ch YoY | -11.55 | -13.42 | -10.46 | -8.77 | -11.17 | -12.11 |
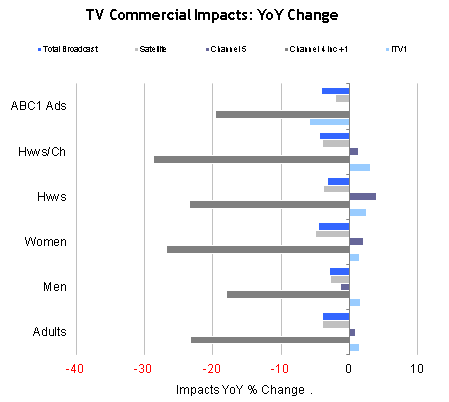
Commercial Impacts
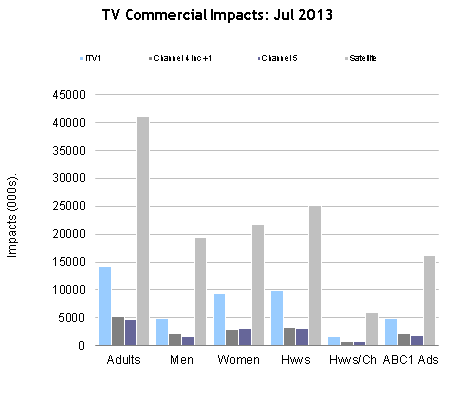
| Impacts | Adults | Men | Women | Hwvs | Hwvs/Ch | ABC1 Adults |
|---|---|---|---|---|---|---|
| ITV1 | 14,132.19 | 4,811.20 | 9,320.98 | 9,815.89 | 1,612.43 | 4,832.52 |
| % Ch YoY | 1.48 | 1.54 | 1.45 | 2.46 | 3.11 | -5.80 |
| Channel 4 inc +1 | 5,199.59 | 2,225.11 | 2,974.49 | 3,314.09 | 733.67 | 2,213.97 |
| % Ch YoY | -23.28 | -17.97 | -26.82 | -23.41 | -28.66 | -19.65 |
| Channel 5 | 4,673.31 | 1,674.13 | 2,999.15 | 2,999.15 | 694.27 | 1,731.03 |
| % Ch YoY | 0.82 | -1.31 | 2.05 | 3.98 | 1.25 | 0.17 |
| Satellite | 41,161.35 | 19,498.29 | 21,663.00 | 25,183.53 | 5,889.72 | 16,135.57 |
| % Ch YoY | -3.98 | -2.82 | -5.00 | -3.75 | -3.96 | -2.14 |
| Total Broadcast | 66,312.33 | 28,531.95 | 37,780.29 | 42,423.60 | 9,125.74 | 25,337.51 |
| % Ch YoY | -3.92 | -2.99 | -4.62 | -3.31 | -4.42 | -4.13 |
TV market data is available in
mediatel.co.uk’s TV Database.