


The majority of commercial television channels performed well in May, with just one reporting a loss in revenue.
A -0.5% decline in revenue meant that Channel 4 was down just over £200,000 on the previous year, to record a total of £45.3 million.
ITV Breakfast put in the strongest performance in May, up 19.3% to secure just over £5.3 million – growth of almost £9 million.
An 8.5% increase saw ITV hit revenue of £125 million, while a small 2.9% lift saw Channel 5 secure £26.3 million.
Overall Total Terrestrial (inc. ITV Breakfast) was up 5.8% to secure just short of £202 million, while Total Satellite was up 8.9% to secure £146.6 million.
Network Revenue
| Total Revenue | May 13 | May 14 | % Change |
|---|---|---|---|
| ITV1 | 115,230,000 | 125,000,000 | 8.5 |
| Channel 4 | 45,490,000 | 45,260,000 | -0.5 |
| Channel 5 | 25,520,000 | 26,260,000 | 2.9 |
| ITV Breakfast | 4,460,000 | 5,320,000 | 19.3 |
| Total Terrestrial (inc. ITV Breakfast) | 190,700,000 | 201,840,000 | 5.8 |
| Total Satellite | 134,600,000 | 146,550,000 | 8.9 |
Source: Agency Estimates
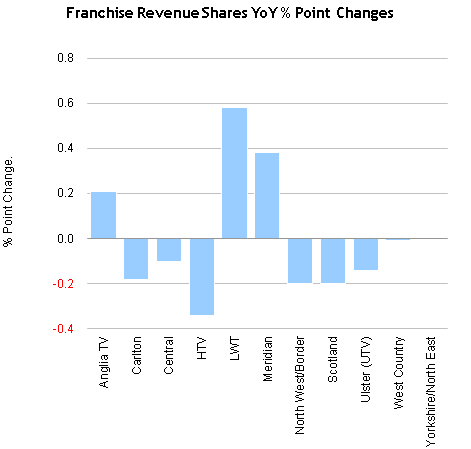
ITV Franchise Area
| % Share of ITV Revenue by Franchise | May 13 | May 14 | % Point Change |
|---|---|---|---|
| Anglia TV | 7.50 | 7.71 | 0.21 |
| Carlton | 12.13 | 11.95 | -0.18 |
| Central | 15.61 | 15.51 | -0.10 |
| HTV | 6.40 | 6.06 | -0.34 |
| LWT | 12.59 | 13.17 | 0.58 |
| Meridian | 11.18 | 11.56 | 0.38 |
| North West/Border | 11.24 | 11.04 | -0.20 |
| Scotland | 7.57 | 7.37 | -0.20 |
| Ulster (UTV) | 2.43 | 2.29 | -0.14 |
| West Country | 1.95 | 1.94 | -0.01 |
| Yorkshire/North East | 11.39 | 11.39 | n/a |
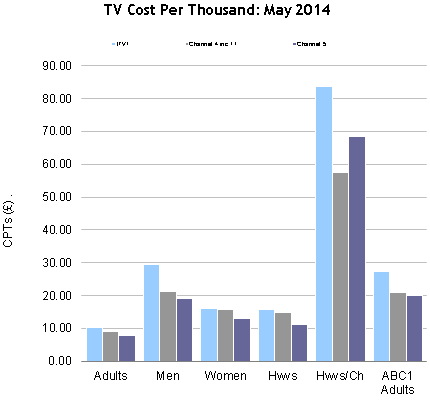
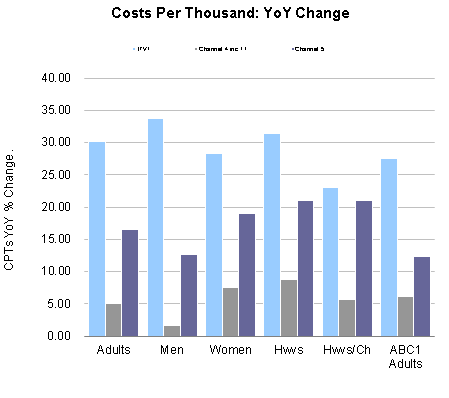
Network CPTs
| CPTs | Adults | Men | Women | Hwvs | Hwvs/Ch | ABC1 Adults |
|---|---|---|---|---|---|---|
| ITV1 | 10.38 | 29.47 | 16.03 | 15.64 | 83.79 | 27.40 |
| % Ch YoY | 30.16 | 33.74 | 28.22 | 31.35 | 22.95 | 27.53 |
| Channel 4 inc +1 | 9.09 | 21.35 | 15.83 | 14.79 | 57.49 | 21.01 |
| % Ch YoY | 4.99 | 1.69 | 7.44 | 8.70 | 5.59 | 6.11 |
| Channel 5 | 7.69 | 19.11 | 12.88 | 11.31 | 68.50 | 20.09 |
| % Ch YoY | 16.47 | 12.68 | 19.03 | 20.99 | 21.00 | 12.36 |
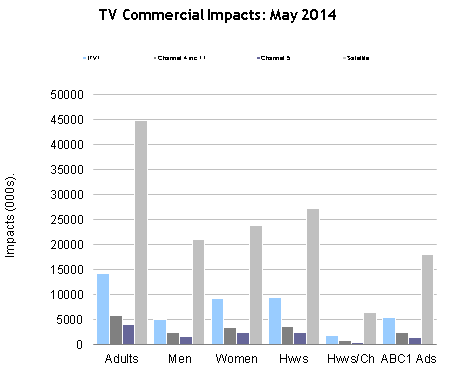
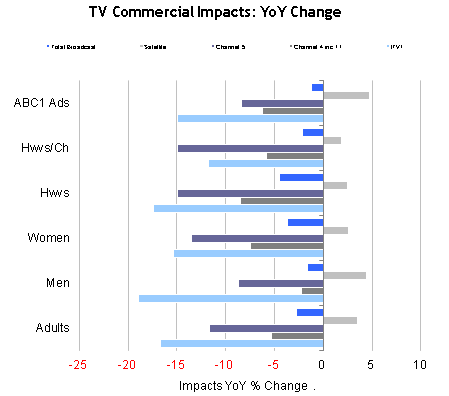
Commercial Impacts
| Impacts | Adults | Men | Women | Hwvs | Hwvs/Ch | ABC1 Adults |
|---|---|---|---|---|---|---|
| ITV1 | 14,163.29 | 4,990.23 | 9,173.06 | 9,404.94 | 1,755.07 | 5,366.77 |
| % Ch YoY | -16.66 | -18.88 | -15.39 | -17.41 | -11.77 | -14.93 |
| Channel 4 inc +1 | 5,858.24 | 2,493.62 | 3,364.61 | 3,600.02 | 926.26 | 2,534.74 |
| % Ch YoY | -5.28 | -2.24 | -7.42 | -8.51 | -5.78 | -6.26 |
| Channel 5 | 4,015.25 | 1,617.06 | 2,398.18 | 2,398.18 | 451.02 | 1,538.17 |
| % Ch YoY | -11.65 | -8.67 | -13.54 | -14.94 | -14.95 | -8.41 |
| Satellite | 44,890.76 | 20,950.82 | 23,939.96 | 27,296.69 | 6,391.52 | 18,079.69 |
| % Ch YoY | 3.46 | 4.45 | 2.61 | 2.50 | 1.91 | 4.68 |
| Total Broadcast | 70,433.74 | 30,551.22 | 39,882.55 | 44,008.68 | 9,758.56 | 28,156.73 |
| % Ch YoY | -2.78 | -1.58 | -3.68 | -4.46 | -2.11 | -1.25 |






•
May cpt’s are up year on year, quite substantially in some cases, not down. Your Total Broadcast figures in the commercial impacts table are clearly wrong as well.
•
Hi — apologies, you are absolutely correct. We have updated the tables and graphs. Thanks, the Newsline team.