
Q1 2010 RAJAR figures reveal that DAB set ownership increased 9% year on year, with 17.7 million adults aged 15+ now claiming to live in a DAB household.
DAB now has a 15.1% share of all radio listening, up 20% year on year.
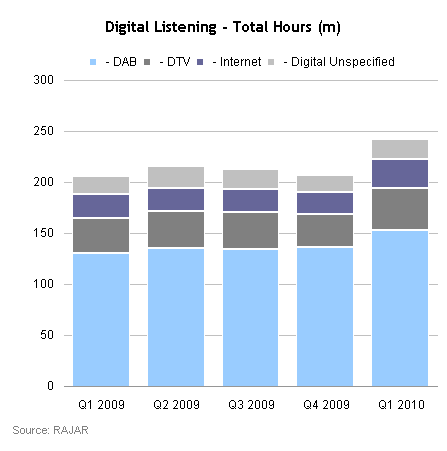
Total hours spent listening to radio via DAB hit 153 hours, up 17 hours from Q4 2009.
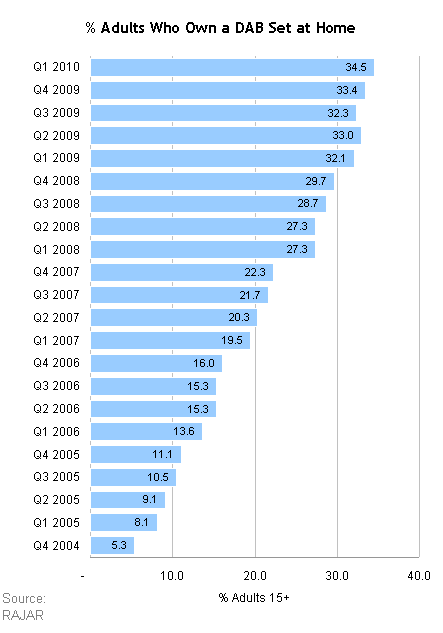
Listening to the radio via a digital platform in terms of weekly reach increased 15% year on year to 19.7 million people.
Total digital listening hours for Q1 2010 now stand at 243 million hours per week, up an impressive 18% year on year.
| AM/FM | All Digital | – DAB | – DTV | – Internet | – Digital Unspecified | |
|---|---|---|---|---|---|---|
| Platform Shares (%) | ||||||
| Q1 2009 | 67.5 | 20.1 | 12.7 | 3.4 | 2.2 | 1.8 |
| Q2 2009 | 66.2 | 21.1 | 13.1 | 3.6 | 2.2 | 2.1 |
| Q3 2009 | 66.1 | 21.1 | 13.3 | 3.6 | 2.2 | 2.0 |
| Q4 2009 | 66.6 | 20.9 | 13.7 | 3.4 | 2.1 | 1.7 |
| Q1 2010 | 66.7 | 24 | 15.1 | 4.0 | 2.9 | 1.9 |
| Digital Listening Weekly Reach (%) | ||||||
| Q1 2009 | n/a | 33.8 | 19.9 | 11.1 | 6.8 | 7.4 |
| Q2 2009 | n/a | 35.0 | 20.6 | 11.1 | 6.8 | 8.0 |
| Q3 2009 | n/a | 34.5 | 20.5 | 11.3 | 6.5 | 7.5 |
| Q4 2009 | n/a | 33.4 | 20.4 | 10.5 | 6.3 | 6.9 |
| Q1 2010 | n/a | 38.5 | 23.1 | 12.6 | 8.1 | 7.5 |
| Digital Listening Total Hours (m) | ||||||
| Q1 2009 | n/a | 206 | 130 | 35 | 23 | 18 |
| Q2 2009 | n/a | 217 | 135 | 37 | 22 | 22 |
| Q3 2009 | n/a | 213 | 134 | 37 | 22 | 20 |
| Q4 2009 | n/a | 206 | 136 | 33 | 21 | 17 |
| Q1 2010 | n/a | 243 | 153 | 41 | 29 | 19 |
Source: RAJAR
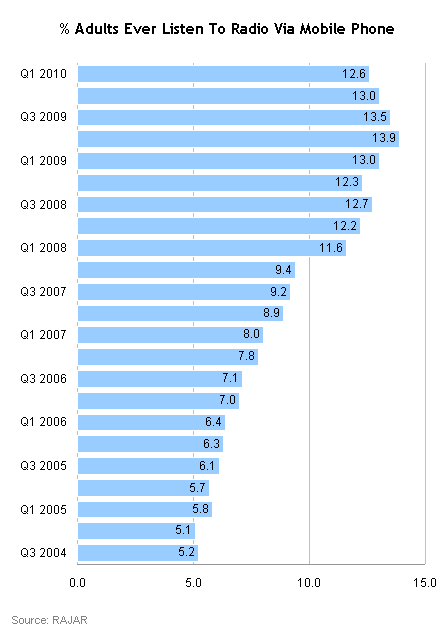
Listening to the radio via a mobile phone stands at 12.6% of adults aged 15+, down slightly from 13% Q4 2009.
Looking at the 15-24 year old demographic, 30.4% claim to have listened to the radio in this way in the first quarter, with 14% saying they have listened via mobile once a week, while 26% they listen every day.
In the 25+ demographic, 9.2% of adults now claim to listen to the radio via their mobile phone.
In Q1 2010 RAJAR introduced a number of changes to the self-completion questionnaire which impacted on questions regarding mobile phone listening: therefore caution should be used when comparing Q1 2010 with similar data from previous quarters.
MediaTel has PowerPoint presentations available to download, featuring pre-prepared market breakdown graphs for the latest RAJAR data release – click here.