
Commercial listening suffered a slight drop in Q4, with local commercial stations seeing a dip in figures.
However, national commercial stations made a gain – up QoQ and YoY.
The BBC, meanwhile, enjoyed an overall increase in listening, with BBC local stations seeing a decent rise in reach during the period.
Share of listening
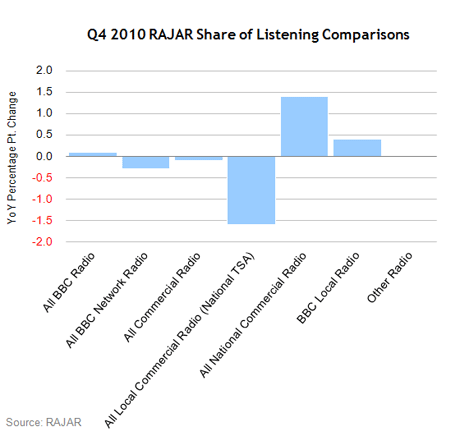
The gap widened between commercial radio and the BBC’s share of listening, as all commercial recorded a slight decrease – down by 0.9 percentage points QoQ, taking its total to 42.5%.
The BBC, on the other hand, increased its share by 1.0 percentage points QoQ, taking its total share up to 55.3%.
| Ending Dec 09 | Ending Mar 10 | Ending Jun 10 | Ending Sep 10 | Ending Dec 10 | QoQ % Point Change Sep 10 vs Dec 10 | YoY % Point Change Dec 09 vs Dec 10 | |
|---|---|---|---|---|---|---|---|
| All Radio | 100.0 | 100.0 | 100.0 | 100.0 | 100.0 | 0.0 | 0.0 |
| All BBC Radio | 55.2 | 56.5 | 54.6 | 54.3 | 55.3 | 1.0 | 0.1 |
| All BBC Network Radio | 46.7 | 47.2 | 46.2 | 45.4 | 46.4 | 1.0 | -0.3 |
| All Commercial Radio | 42.6 | 41.3 | 43.2 | 43.4 | 42.5 | -0.9 | -0.1 |
| All Local Commercial Radio (National TSA) | 32.2 | 31.1 | 32.2 | 32.2 | 30.6 | -1.6 | -1.6 |
| All National Commercial Radio | 10.4 | 10.3 | 11.0 | 11.2 | 11.8 | 0.6 | 1.4 |
| BBC Local Radio | 8.5 | 9.3 | 8.3 | 9.0 | 8.9 | -0.1 | 0.4 |
| Other Radio | 2.2 | 2.2 | 2.2 | 2.2 | 2.2 | 0.0 | 0.0 |
Source: RAJAR
Weekly Reach
All Radio suffered a tiny dip in reach during quarter four, although more people tuned in compared to Q4 2009.
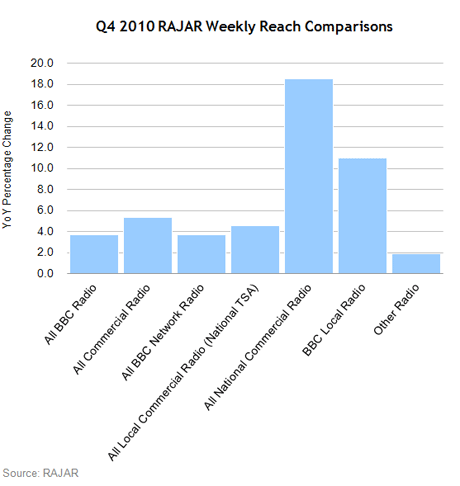
Commercial radio stations now have an overall weekly reach of more than 33 million, down slightly on Q3 2010 but up on the same period a year ago. By comparison, all BBC radio has a weekly reach of 34.5 million.
All national commercial radio saw the highest YoY percentage increase – up 18.5%, while all local commercial radio (National TSA) posted a 4.6% YoY rise and a small 2% QoQ decline.
BBC network radio and BBC local radio stations managed to increase their weekly reach both YoY and QoQ.
| Ending Dec 09 | Ending Mar 10 | Ending Jun 10 | Ending Sep 10 | Ending Dec 10 | QoQ % Change Sep 10 vs Dec 10 | YoY % Change Dec 09 vs Dec 10 | |
|---|---|---|---|---|---|---|---|
| All Radio | 45,968 | 46,479 | 46,771 | 46,762 | 46,727 | -0.1 | 1.7 |
| All BBC Radio | 33,264 | 34,877 | 34,585 | 34,243 | 34,505 | 0.8 | 3.7 |
| All Commercial Radio | 31,374 | 32,162 | 32,873 | 33,373 | 33,059 | -0.9 | 5.4 |
| All BBC Network Radio | 30,010 | 31,318 | 31,263 | 31,018 | 31,128 | 0.4 | 3.7 |
| All Local Commercial Radio (National TSA) | 25,306 | 26,089 | 26,700 | 26,999 | 26,462 | -2.0 | 4.6 |
| All National Commercial Radio | 13,001 | 13,614 | 14,608 | 15,101 | 15,407 | 2.0 | 18.5 |
| BBC Local Radio | 8,862 | 9,987 | 9,135 | 9,144 | 9,836 | 7.6 | 11.0 |
| Other Radio | 3,004 | 3,443 | 3,274 | 3,127 | 3,061 | -2.1 | 1.9 |
Source: RAJAR
Average Hours Per Listener
This quarter has seen a drop in the number of hours people spend listening to radio overall, though once again, average hours are up on this time a year ago.
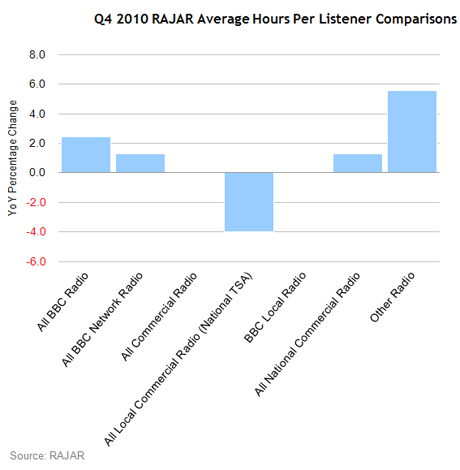
All BBC enjoyed a rise in the number of hours people stayed tuned in. However, commercial stations saw average hours remain static during the year and dip on the third quarter.
Locally, both the BBC and commercial stations struggled slightly – down 7.8% and 4% respectively. However, all national commercial and all BBC network radio recorded positive rises during the period.
| Ending Dec 09 | Ending Mar 10 | Ending Jun 10 | Ending Sep 10 | Ending Dec 10 | QoQ % Change Sep 10 vs Dec 10 | YoY % Change Dec 09 vs Dec 10 | |
|---|---|---|---|---|---|---|---|
| All Radio | 21.5 | 21.8 | 22.0 | 22.6 | 22.4 | -0.9 | 4.2 |
| All BBC Radio | 16.4 | 16.4 | 16.3 | 16.7 | 16.8 | 0.6 | 2.4 |
| All BBC Network Radio | 15.4 | 15.3 | 15.2 | 15.4 | 15.6 | 1.3 | 1.3 |
| All Commercial Radio | 13.4 | 13.0 | 13.5 | 13.7 | 13.4 | -2.2 | 0.0 |
| All Local Commercial Radio (National TSA) | 12.6 | 12.1 | 12.4 | 12.6 | 12.1 | -4.0 | -4.0 |
| BBC Local Radio | 9.5 | 9.4 | 9.4 | 10.3 | 9.5 | -7.8 | 0.0 |
| All National Commercial Radio | 7.9 | 7.6 | 7.8 | 7.9 | 8.0 | 1.3 | 1.3 |
| Other Radio | 7.2 | 6.5 | 6.9 | 7.6 | 7.6 | 0.0 | 5.6 |
Source: RAJAR
Platform Share
MediaTel has PowerPoint presentations available to download, featuring pre-prepared market breakdown graphs for the RAJAR data release – click here.