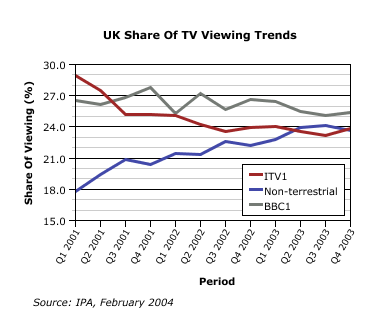
ITV clawed back some viewing share from the multichannel sector during the final quarter of 2003, according to the latest Trends In Television report from the IPA.
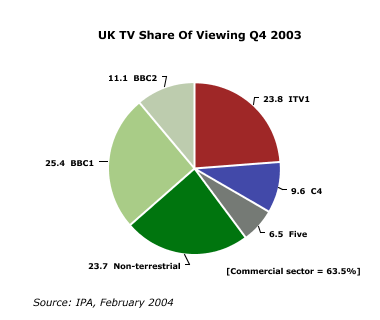
The figures show that ITV’s share of viewing was 23.8% in Q4, marginally ahead of multichannel’s 23.7%, but still behind BBC1’s 25.4%. However, whilst ITV made up some ground in a quarter on quarter analysis – from 23.2% to 23.8% – share was actually down very slightly year on year, from 23.9% to 23.8%.
The commercial sector enjoyed a year on year growth in share, largely at the expense of BBC1. ITV, Channel 4, Five and the multichannel stations saw their combined share of viewing rise from 61.8% in Q4 2002 to 63.5% in Q4 2003.
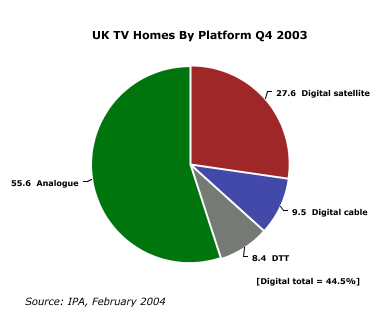
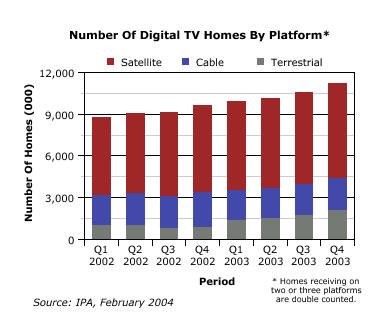
TV platforms The report also tracks the number of homes using each type of broadcast platform. Since Q1 2002, the number of digital homes has increased from 8.7 million to 11.0 million, whilst analogue homes have fallen from 15.9 million to 13.7 million.
Digital satellite is the clear market leader in the DTV sector, with BSkyB’s service installed in 6.8 million homes by the end of the year, according to the IPA figures. Digital terrestrial TV (DTT), provided by Freeview, was received in 2.1 million homes and digital cable reached 2.3 million homes.
The combined total for the three platforms – satellite, cable and terrestrial (11.2 million) – is a higher figure than the total number of digital homes (11.0 million) due to the fact that some households may have more than one receiver unit.
| UK TV Homes Platform Universes (000s) | ||||||||
| Â | Dig-sat | Dig-cable | Dig-terr | Total digital | Total anlg | Anlg cable | Anlg terr | All platforms |
| Q1 2002 | 5,583 | 2,223 | 974 | 8,716 | 15,865 | 1,637 | 14,013 | 24,528 |
| Q2 2002 | 5,730 | 2,330 | 997 | 8,905 | 15,731 | 1,310 | 14,136 | 24,570 |
| Q3 2002 | 6,105 | 2,292 | 763 | 9,015 | 15,645 | 1,148 | 14,265 | 24,613 |
| Q4 2002 | 6,247 | 2,516 | 873 | 9,491 | 15,283 | 924 | 14,127 | 24,727 |
| Q1 2003 | 6,372 | 2,156 | 1,398 | 9,718 | 15,101 | 1,222 | 13,647 | 24,772 |
| Q2 2003 | 6,470 | 2,156 | 1,510 | 9,928 | 14,930 | 1,122 | 13,576 | 24,811 |
| Q3 2003 | 6,600 | 2,250 | 1,710 | 10,354 | 14,544 | 1,010 | 13,303 | 24,857 |
| Q4 2003 | 6,785 | 2,326 | 2,075 | 10,961 | 13,688 | 951 | 12,576 | 24,612 |
| Source: IPA, February 2004 | ||||||||
| UK TV Homes Platform Universes Share (%) | ||||||||
| Dig-sat | Dig-cable | Dig-terr | Total digital | Total anlg | Anlg cable | Anlg terr | All platforms | |
| Q1 2002 | 22.8 | 9.1 | 4.0 | 35.5 | 64.7 | 6.7 | 57.1 | 100.0 |
| Q2 2002 | 23.3 | 9.5 | 4.1 | 36.2 | 64.0 | 5.3 | 57.5 | 100.0 |
| Q3 2002 | 24.8 | 9.0 | 3.1 | 36.6 | 63.6 | 4.7 | 58.0 | 100.0 |
| Q4 2002 | 25.3 | 10.0 | 3.5 | 38.4 | 61.8 | 3.7 | 57.1 | 100.0 |
| Q1 2003 | 25.7 | 9.0 | 5.6 | 39.2 | 61.0 | 4.9 | 55.1 | 100.0 |
| Q2 2003 | 26.1 | 8.7 | 6.1 | 40.0 | 60.2 | 4.5 | 54.7 | 100.0 |
| Q3 2003 | 26.6 | 9.1 | 6.9 | 41.7 | 58.5 | 4.1 | 53.5 | 100.0 |
| Q4 2003 | 27.6 | 9.5 | 8.4 | 44.5 | 55.6 | 3.9 | 51.1 | 100.0 |
| Source: IPA, February 2004 | ||||||||