
Commercial radio thrived in Q2 2010; increasing both its weekly reach and share of listening. Moreover, the latest figures not only highlight a positive quarter for the commercial sector but also represent its highest share since September 2007 and largest reach since the new survey began reporting in June 2007, showing that more and more people are tuning in to commercial radio.
By comparison, the BBC struggled during Q2, posting period on period declines in all three RAJAR categories – Reach, Share of Listening and Average Hours.
The BBC did, however, manage more positive year on year results.
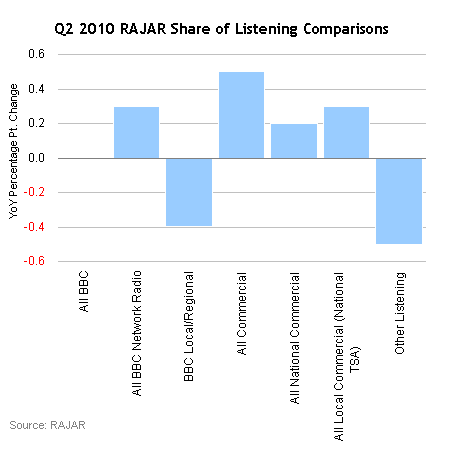
Share of Listening
All Commercial continued to gain ground against the BBC’s majority share, increasing its share of listening by 1.9 percentage points period on period – and 0.5 percentage points year on year – which takes its total to 43.2%.
Within this, All National Commercial posted a 0.7 percentage points rise on Q1 2010, while All Local Commercial recorded a slightly higher 1.1 percentage points increase.
The BBC remained static compared with this time last year, but suffered a period on period fall of 1.9 percentage points. The BBC now has a 54.6% total share of listening. All BBC Network Radio and BBC Local/Regional stations posted an equal 1.0 percentage point drop in the second quarter.
| Ending Jun 09 | Ending Sep 09 | Ending Dec 09 | Ending Mar 10 | Ending Jun 10 | YoY % Point Change Jun 09 vs Jun 10 | QoQ % Point Change Mar 10 vs Jun 10 | |
|---|---|---|---|---|---|---|---|
| All BBC | 54.6 | 55.0 | 55.2 | 56.5 | 54.6 | 0.0 | -1.9 |
| All BBC Network Radio | 45.9 | 46.8 | 46.7 | 47.2 | 46.2 | 0.3 | -1.0 |
| BBC Local/Regional | 8.7 | 8.2 | 8.5 | 9.3 | 8.3 | -0.4 | -1.0 |
| All Commercial | 42.7 | 42.4 | 42.6 | 41.3 | 43.2 | 0.5 | 1.9 |
| All National Commercial | 10.8 | 10.9 | 10.4 | 10.3 | 11.0 | 0.2 | 0.7 |
| All Local Commercial (National TSA) | 31.9 | 31.6 | 32.2 | 31.1 | 32.2 | 0.3 | 1.1 |
| Other Listening | 2.7 | 2.5 | 2.2 | 2.2 | 2.2 | -0.5 | 0.0 |
Source: RAJAR
Weekly Reach
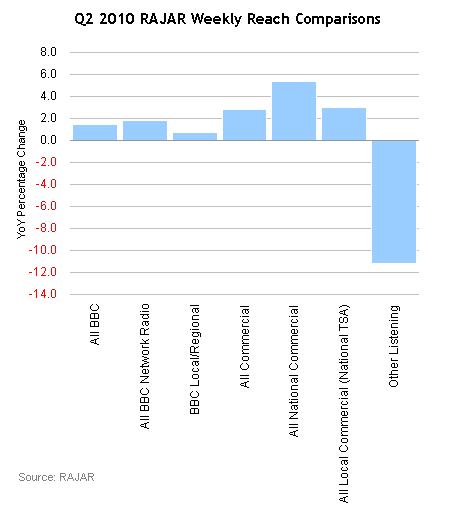
The Q2 2010 figures show that more and more people are now listening to commercial stations. All Commercial enjoyed both year on year and period on period rises (2.8% and 2.2% respectively) – leaving it with a weekly reach of more than 32.8 million.
All National Commercial posted impressive growth in its weekly reach, up 5.3% year on year and 7.3% period on period, to 14.6 million listeners. And with a solid 3% year on year (and 2.3% period on period) increase, All Local Commercial (National TSA) now has 26.7 million listeners.
The BBC, on the other hand, recorded period on period declines for All BBC, All BBC Network Radio and All Local/Regional. All BBC saw a relatively small 0.8% period on period drop, taking its total to 34.5 million listeners. However, BBC local and regional stations suffered fairly heavy losses during the three month period, down by 8.5%, suggesting that listeners are switching to commercial stations.
| Ending Jun 09 | Ending Sep 09 | Ending Dec 09 | Ending Mar 10 | Ending Jun 10 | YoY % Change Jun 09 vs Jun 10 | QoQ % Change Mar 10 vs Jun 10 | |
|---|---|---|---|---|---|---|---|
| All BBC | 34,098 | 33,577 | 33,264 | 34,877 | 34,585 | 1.4 | -0.8 |
| All BBC Network Radio | 30,706 | 30,264 | 30,010 | 31,318 | 31,263 | 1.8 | -0.2 |
| BBC Local/Regional | 9,072 | 8,532 | 8,862 | 9,987 | 9,135 | 0.7 | -8.5 |
| All Commercial | 31,968 | 31,225 | 31,374 | 32,162 | 32,873 | 2.8 | 2.2 |
| All National Commercial | 13,868 | 13,516 | 13,001 | 13,614 | 14,608 | 5.3 | 7.3 |
| All Local Commercial (National TSA) | 25,916 | 25,069 | 25,306 | 26,089 | 26,700 | 3.0 | 2.3 |
| Other Listening | 3,686 | 3,762 | 3,004 | 3,443 | 3,274 | -11.2 | -4.9 |
Source: RAJAR
Average Hours Per Listener
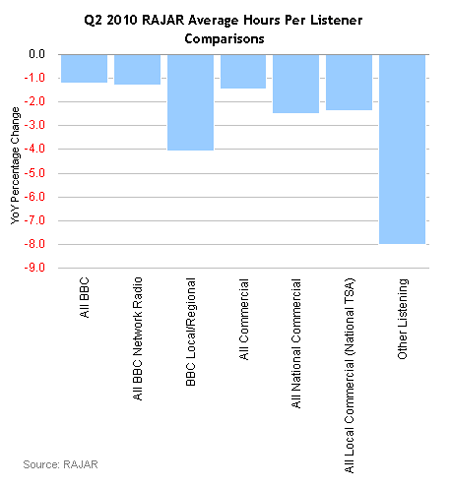
Unfortunately, the average number of hours people spend listening to radio (either commercial or BBC stations) has decreased over the past year. Having said that, commercial radio kept listeners for longer periods of time in Q2 2010 compared with the previous two quarters – hopefully an indication of a continued rise.
All Commercial saw its average hours fall 1.5% year on year, but rise 3.8% period on period, boosting its total to 13.5 hours – an improvement on last quarter’s 13 hours.
Once again, the BBC suffered in this category. Despite claiming more hours than its commercial rivals in general, the BBC is seeing a consistent drop in the number of hours people tune in for. In Q2 2010, All BBC saw its average hours drop 1.2% year on year and 0.6% period on period. As a result, its average hours have gone down to 16.3.
| Ending Jun 09 | Ending Sep 09 | Ending Dec 09 | Ending Mar 10 | Ending Jun 10 | YoY % Change Jun 09 vs Jun 10 | QoQ % Change Mar 10 vs Jun 10 | |
|---|---|---|---|---|---|---|---|
| All BBC | 16.5 | 16.5 | 16.4 | 16.4 | 16.3 | -1.2 | -0.6 |
| All BBC Network Radio | 15.4 | 15.6 | 15.4 | 15.3 | 15.2 | -1.3 | -0.7 |
| BBC Local/Regional | 9.8 | 9.7 | 9.5 | 9.4 | 9.4 | -4.1 | 0.0 |
| All Commercial | 13.7 | 13.7 | 13.4 | 13.0 | 13.5 | -1.5 | 3.8 |
| All National Commercial | 8.0 | 8.1 | 7.9 | 7.6 | 7.8 | -2.5 | 2.6 |
| All Local Commercial (National TSA) | 12.7 | 12.7 | 12.6 | 12.1 | 12.4 | -2.4 | 2.5 |
| Other Listening | 7.5 | 6.8 | 7.2 | 6.5 | 6.9 | -8.0 | 6.2 |
Source: RAJAR
MediaTel has PowerPoint presentations available to download, featuring pre-prepared market breakdown graphs for the latest RAJAR data release – click here.