
The latest RAJAR figures show a positive period for the radio industry with commercial radio’s share up 1.3% YoY and reach up 5.9% YoY.
All Radio saw its reach hit the 47 million mark for the first time ever, while All Commercial Radio recorded its highest ever reach (over 34 million listeners).
Meanwhile, All National Commercial posted a huge YoY rise due to the recent changes to the Heart, Smooth and Capital brands.
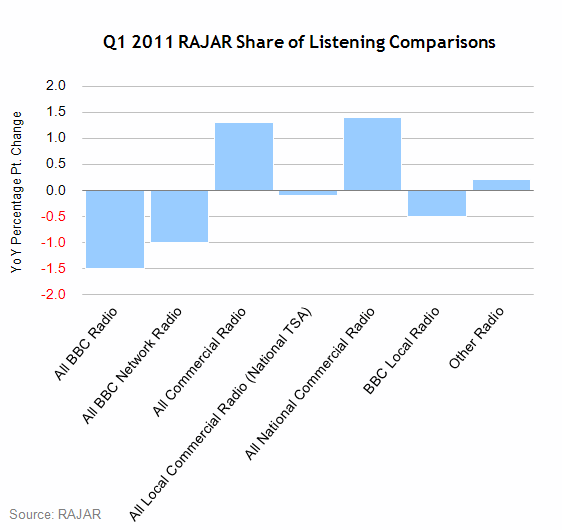
Share of Listening
Commercial radio managed to gain some ground on the BBC’s share of listening after posting a small 1.3% YoY increase, while the BBC suffered a -1.5% decrease. All Commercial Radio now has a 42.6% share compared to the BBC’s 55% share.
| Ending Mar 10 | Ending Jun 10 | Ending Sep 10 | Ending Dec 10 | Ending Mar 11 | QoQ % Point Change Dec 10 vs Mar 11 | YoY % Point Change Mar 10 vs Mar 11 | |
|---|---|---|---|---|---|---|---|
| All Radio | 100.0 | 100.0 | 100.0 | 100.0 | 100.0 | 0.0 | 0.0 |
| All BBC Radio | 56.5 | 54.6 | 54.3 | 55.3 | 55.0 | -0.3 | -1.5 |
| All BBC Network Radio | 47.2 | 46.2 | 45.4 | 46.4 | 46.2 | -0.2 | -1.0 |
| All Commercial Radio | 41.3 | 43.2 | 43.4 | 42.5 | 42.6 | 0.1 | 1.3 |
| All Local Commercial Radio (National TSA) | 31.1 | 32.2 | 32.2 | 30.6 | 31.0 | 0.4 | -0.1 |
| All National Commercial Radio | 10.3 | 11.0 | 11.2 | 11.8 | 11.7 | -0.1 | 1.4 |
| BBC Local Radio | 9.3 | 8.3 | 9.0 | 8.9 | 8.8 | -0.1 | -0.5 |
| Other Radio | 2.2 | 2.2 | 2.2 | 2.2 | 2.4 | 0.2 | 0.2 |
Source: RAJAR
Weekly Reach
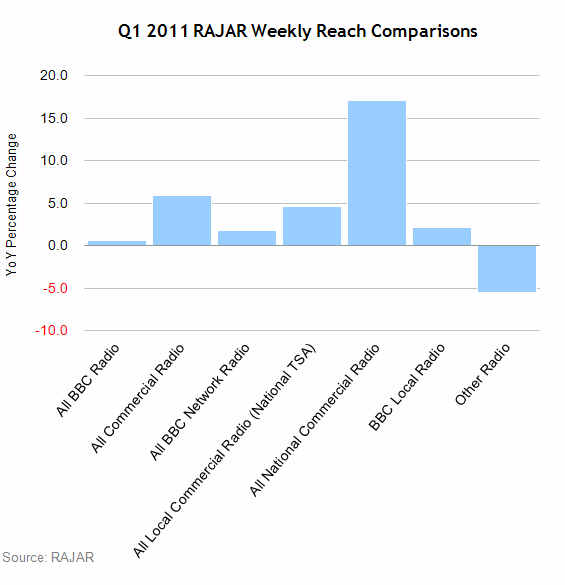
All Radio bounced back in Q1 2011 after a slight dip last quarter. A 1.7% YoY increase in reach has pushed All Radio Listening past the 47 million mark for the first time ever.
Positively, the BBC and commercial radio increased their reach both YoY and QoQ. All Commercial Radio enjoyed its highest ever figure after a 5.9% YoY jump, which takes its weekly reach over the 34 million listener mark for the first time. By comparison, all BBC Radio has a weekly reach of 35 million.
Meanwhile, National Commercial Radio posted a significant 17.1% YoY rise following the roll-out of national brands including Heart, Smooth and Capital.
| Ending Mar 10 | Ending Jun 10 | Ending Sep 10 | Ending Dec 10 | Ending Mar 11 | QoQ % Change Dec 10 vs Mar 11 | YoY % Change Mar 10 vs Mar 11 | |
|---|---|---|---|---|---|---|---|
| All Radio | 46,479 | 46,771 | 46,762 | 46,727 | 47,266 | 1.2 | 1.7 |
| All BBC Radio | 34,877 | 34,585 | 34,243 | 34,505 | 35,074 | 1.6 | 0.6 |
| All Commercial Radio | 32,162 | 32,873 | 33,373 | 33,059 | 34,046 | 3.0 | 5.9 |
| All BBC Network Radio | 31,318 | 31,263 | 31,018 | 31,128 | 31,889 | 2.4 | 1.8 |
| All Local Commercial Radio (National TSA) | 26,089 | 26,700 | 26,999 | 26,462 | 27,305 | 3.2 | 4.7 |
| All National Commercial Radio | 13,614 | 14,608 | 15,101 | 15,407 | 15,943 | 3.5 | 17.1 |
| BBC Local Radio | 9,987 | 9,135 | 9,144 | 9,836 | 10,197 | 3.7 | 2.1 |
| Other Radio | 3,443 | 3,274 | 3,127 | 3,061 | 3,255 | 6.3 | -5.5 |
Source: RAJAR
Average Hours Per Listener
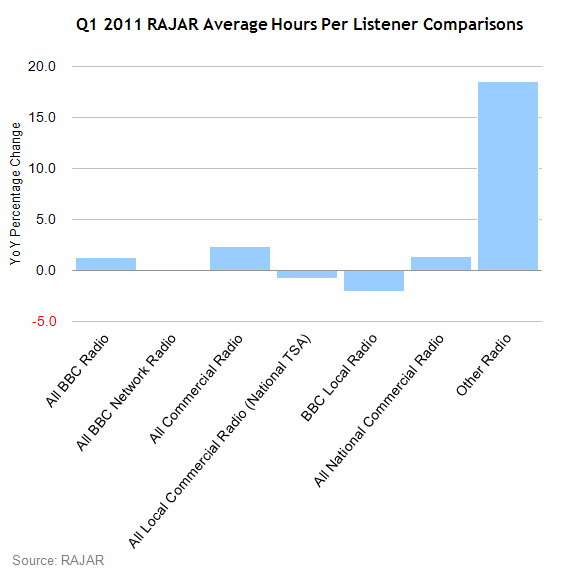
This quarter has seen the number of hours people spend listening to radio remain static, though average hours are up on this time last year.
All Commercial Radio enjoyed a boost in the amount of time people stayed tuned in for over the year, up 2.3%, while the BBC posted a 1.2% YoY increase in hours. However, both the BBC and commercial radio saw their average hours dip compared to Q4 2010.
| Ending Mar 10 | Ending Jun 10 | Ending Sep 10 | Ending Dec 10 | Ending Mar 11 | QoQ % Change Dec 10 vs Mar 11 | YoY % Change Mar 10 vs Mar 11 | |
|---|---|---|---|---|---|---|---|
| All Radio | 21.8 | 22.0 | 22.6 | 22.4 | 22.4 | 0.0 | 2.8 |
| All BBC Radio | 16.4 | 16.3 | 16.7 | 16.8 | 16.6 | -1.2 | 1.2 |
| All BBC Network Radio | 15.3 | 15.2 | 15.4 | 15.6 | 15.3 | -1.9 | 0.0 |
| All Commercial Radio | 13.0 | 13.5 | 13.7 | 13.4 | 13.3 | -0.7 | 2.3 |
| All Local Commercial Radio (National TSA) | 12.1 | 12.4 | 12.6 | 12.1 | 12.0 | -0.8 | -0.8 |
| BBC Local Radio | 9.4 | 9.4 | 10.3 | 9.5 | 9.2 | -3.2 | -2.1 |
| All National Commercial Radio | 7.6 | 7.8 | 7.9 | 8.0 | 7.7 | -3.8 | 1.3 |
| Other Radio | 6.5 | 6.9 | 7.6 | 7.6 | 7.7 | 1.3 | 18.5 |
Source: RAJAR
Platform Share
MediaTel has PowerPoint presentations available to download, featuring pre-prepared market breakdown graphs for the RAJAR data release – click here.