
It was a good period for commercial radio in terms of weekly reach, with both year on year and period on period increases in the first quarter.
However, All Commercial saw its share of listening fall slightly while average listening hours were also down.
Looking at the BBC, overall it saw a year on year rise in weekly reach and share of listening, although its average listening hours were also down.
Share of Listening
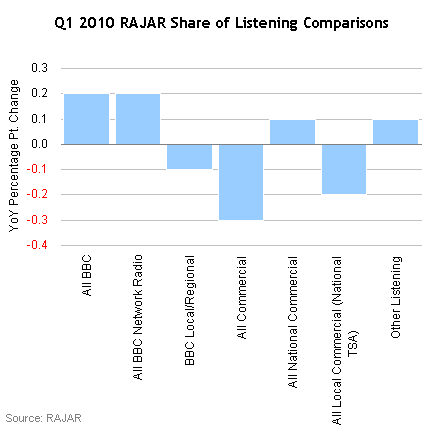
All Commercial saw its share of listening fall very slightly year on year, down 0.3 percentage points to 41.3%.
Within this, All National Commercial remained relatively static, up 0.1 percentage point on Q1 2009 to 10.3%, while All Local Commercial (National TSA) dipped 0.2 percentage points on last year, to 31.1%.
Q1 saw a slight increase in All BBC’s listening share, up 0.2 percentage points to 56.5%. All BBC Network Radio was also up 0.2 percentage points, to 47.2%, while BBC Local/Regional dipped slightly, down 0.1 percentage point to 9.3%.
| Ending Mar 09 | Ending Jun 09 | Ending Sep 09 | Ending Dec 09 | Ending Mar 10 | YoY % Point Change Mar 09 vs Mar 10 | QoQ % Point Change Dec 09 vs Mar 10 | |
|---|---|---|---|---|---|---|---|
| All BBC | 56.3 | 54.6 | 55.0 | 55.2 | 56.5 | 0.2 | 1.3 |
| All BBC Network Radio | 47.0 | 45.9 | 46.8 | 46.7 | 47.2 | 0.2 | 0.5 |
| BBC Local/Regional | 9.4 | 8.7 | 8.2 | 8.5 | 9.3 | -0.1 | 0.8 |
| All Commercial | 41.6 | 42.7 | 42.4 | 42.6 | 41.3 | -0.3 | -1.3 |
| All National Commercial | 10.2 | 10.8 | 10.9 | 10.4 | 10.3 | 0.1 | -0.1 |
| All Local Commercial (National TSA) | 31.3 | 31.9 | 31.6 | 32.2 | 31.1 | -0.2 | -1.1 |
| Other Listening | 2.1 | 2.7 | 2.5 | 2.2 | 2.2 | 0.1 | 0.0 |
Source: RAJAR
Weekly Reach
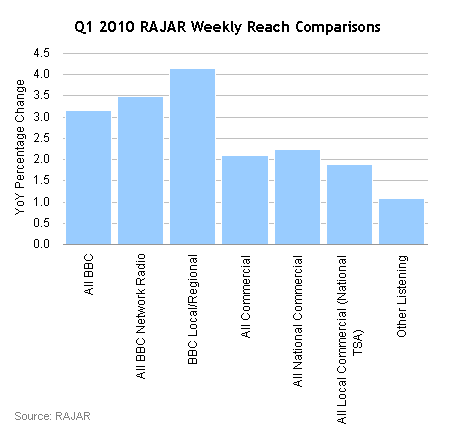
Q1 2010 RAJAR figures show that All Commercial now has a weekly reach of around 32.2 million, up 2.1% year on year and 2.5% on Q4 2009.
All National Commercial enjoyed healthy growth in its weekly reach, up 2.2% year on year and 4.7% period on period, taking its total to 13.6 million listeners.
And with a 1.9% year on year increase and 3.1% period on period rise, All Local Commercial (National TSA) now has 26.1 million listeners a week on average.
The BBC also had a good first quarter in terms of weekly reach, with All BBC up 3.2% on last year and 4.8% period on period, to around 35 million listeners.
All BBC Network Radio now reaches 31.3 million listeners a week following a 3.5% year on year rise, while around 10 million listeners tune into BBC Local/Regional radio each week, after year on year growth of 4.2%.
| Ending Mar 09 | Ending Jun 09 | Ending Sep 09 | Ending Dec 09 | Ending Mar 10 | YoY % Change Mar 09 vs Mar 10 | QoQ % Change Dec 09 vs Mar 10 | |
|---|---|---|---|---|---|---|---|
| All BBC | 33,809 | 34,098 | 33,577 | 33,264 | 34,877 | 3.2 | 4.8 |
| All BBC Network Radio | 30,261 | 30,706 | 30,264 | 30,010 | 31,318 | 3.5 | 4.4 |
| BBC Local/Regional | 9,589 | 9,072 | 8,532 | 8,862 | 9,987 | 4.2 | 12.7 |
| All Commercial | 31,498 | 31,968 | 31,225 | 31,374 | 32,162 | 2.1 | 2.5 |
| All National Commercial | 13,315 | 13,868 | 13,516 | 13,001 | 13,614 | 2.2 | 4.7 |
| All Local Commercial (National TSA) | 25,608 | 25,916 | 25,069 | 25,306 | 26,089 | 1.9 | 3.1 |
| Other Listening | 3,406 | 3,686 | 3,762 | 3,004 | 3,443 | 1.1 | 14.6 |
Source: RAJAR
Average Hours Per Listener
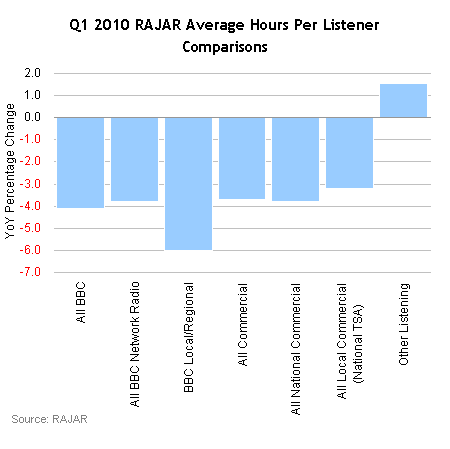
The average number of hours people spent listening to radio decreased for All Commercial and BBC radio in Q1 2010.
All Commercial saw its total average hours per listener figure fall 3.7% year on year to 13 hours. All National Commercial suffered a similar fall, sliding 3.8% to 7.6 hours, while All Local Commercial (National TSA) was down 3.2% to 12.1 hours.
Following a 4.1% year on year fall, listeners now stick with All BBC for an average of 16.4 hours. All BBC Network Radio was down 3.8% to 15.3 hours, while a 6% fall gives BBC Local/Regional an average figure of 9.4 hours.
| Ending Mar 09 | Ending Jun 09 | Ending Sep 09 | Ending Dec 09 | Ending Mar 10 | YoY % Change Mar 09 vs Mar 10 | QoQ % Change Dec 09 vs Mar 10 | |
|---|---|---|---|---|---|---|---|
| All BBC | 17.1 | 16.5 | 16.5 | 16.4 | 16.4 | -4.1 | 0.0 |
| All BBC Network Radio | 15.9 | 15.4 | 15.6 | 15.4 | 15.3 | -3.8 | -0.6 |
| BBC Local/Regional | 10.0 | 9.8 | 9.7 | 9.5 | 9.4 | -6.0 | -1.1 |
| All Commercial | 13.5 | 13.7 | 13.7 | 13.4 | 13.0 | -3.7 | -3.0 |
| All National Commercial | 7.9 | 8.0 | 8.1 | 7.9 | 7.6 | -3.8 | -3.8 |
| All Local Commercial (National TSA) | 12.5 | 12.7 | 12.7 | 12.6 | 12.1 | -3.2 | -4.0 |
| Other Listening | 6.4 | 7.5 | 6.8 | 7.2 | 6.5 | 1.6 | -9.7 |
Source: RAJAR
MediaTel has PowerPoint presentations available to download, featuring pre-prepared market breakdown graphs for the latest RAJAR data release – click here.