
Commercial Radio has enjoyed yet another good RAJAR release, gaining half a million new listeners across national and local stations.
Almost all of these listened to the national commercial stations, while 300,000 listened to local commercial stations as well.
65% of the population now tune in to commercial radio, which now puts All Commercial just 1% behind the BBC. Overall, 91% of the country listen to radio for an average of almost 23 hours a week.
All BBC Network radio saw a drop in listeners over the quarter but managed a year on year increase. BBC Network’s share dropped by almost a percentage point quarter on quarter once again.
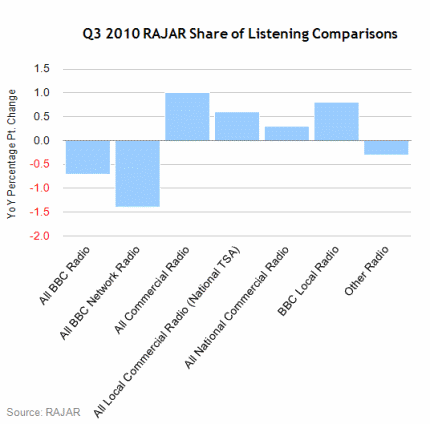
Share of listening
All commercial continued to gain ground against the BBC’s majority share, increasing its share of listening by 0.2 percentage points quarter on quarter and by 1.0 percentage points year on year, taking its total to 43.4.%.
The BBC, meanwhile, suffered both yearly and quarterly drops, leaving it with a total share of listening of 54.3%.
| Ending Sep 09 | Ending Dec 09 | Ending Mar 10 | Ending Jun 10 | Ending Sep 10 | YoY % Point Change Sep 09 vs Sep 10 | QoQ % Point Change Jun 10 vs Sep 10 | |
|---|---|---|---|---|---|---|---|
| All Radio | 100.0 | 100.0 | 100.0 | 100.0 | 100.0 | 0.0 | 0.0 |
| All BBC Radio | 55.0 | 55.2 | 56.5 | 54.6 | 54.3 | -0.7 | -0.3 |
| All BBC Network Radio | 46.8 | 46.7 | 47.2 | 46.2 | 45.4 | -1.4 | -0.8 |
| All Commercial Radio | 42.4 | 42.6 | 41.3 | 43.2 | 43.4 | 1.0 | 0.2 |
| All Local Commercial Radio (National TSA) | 31.6 | 32.2 | 31.1 | 32.2 | 32.2 | 0.6 | 0.0 |
| All National Commercial Radio | 10.9 | 10.4 | 10.3 | 11.0 | 11.2 | 0.3 | 0.2 |
| BBC Local Radio | 8.2 | 8.5 | 9.3 | 8.3 | 9.0 | 0.8 | 0.7 |
| Other Radio | 2.5 | 2.2 | 2.2 | 2.2 | 2.2 | -0.3 | 0.0 |
Source: RAJAR
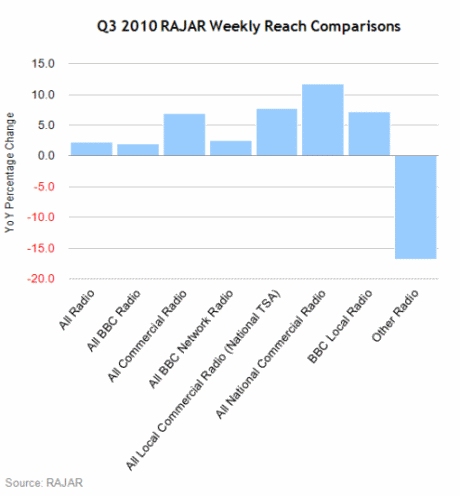
Weekly Reach
The Q3 2010 figures show that more and more people are continuing to tune in to commercial stations. All Commercial enjoyed both year on year and quarter on quarter rises, leaving it with a weekly reach of more than 33.3 million. By comparison, All BBC radio has a weekly reach of 34.2 million.
All National Commercial saw the highest percentage increase – up 11.7% year on year, although All Local Commercial (National TSA) also posted a decent rise – up 7.7% year on year.
The BBC also recorded year on year increases, although All BBC Radio and All BBC Network suffered small drops compared with Q2.
| Ending Sep 09 | Ending Dec 09 | Ending Mar 10 | Ending Jun 10 | Ending Sep 10 | YoY % Change Sep 09 vs Sep 10 | QoQ % Change Jun 10 vs Sep 10 | |
|---|---|---|---|---|---|---|---|
| All Radio | 45,721 | 45,968 | 46,479 | 46,771 | 46,762 | 2.3 | 0.0 |
| All BBC Radio | 33,577 | 33,264 | 34,877 | 34,585 | 34,243 | 2.0 | -1.0 |
| All Commercial Radio | 31,225 | 31,374 | 32,162 | 32,873 | 33,373 | 6.9 | 1.5 |
| All BBC Network Radio | 30,264 | 30,010 | 31,318 | 31,263 | 31,018 | 2.5 | -0.8 |
| All Local Commercial Radio (National TSA) | 25,069 | 25,306 | 26,089 | 26,700 | 26,999 | 7.7 | 1.1 |
| All National Commercial Radio | 13,516 | 13,001 | 13,614 | 14,608 | 15,101 | 11.7 | 3.4 |
| BBC Local Radio | 8,532 | 8,862 | 9,987 | 9,135 | 9,144 | 7.2 | 0.1 |
| Other Radio | 3,762 | 3,004 | 3,443 | 3,274 | 3,127 | -16.9 | -4.5 |
Source: RAJAR
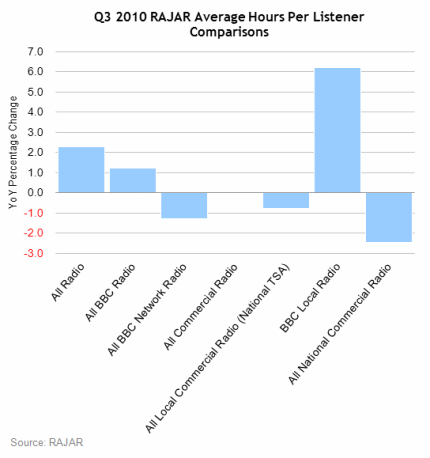
Average Hours Per Listener
Positively, this quarter has seen a rise in the number of hours people spend listening to radio, with both BBC and commercial stations enjoying increases.
However, in terms of year on year figures, all the stations struggled to compete with Q3 2009, with the exception of BBC Local radio stations. All Commercial remained static over the year, while All BBC posted a small increase.
All BBC Network, All Local Commercial and All National Commercial suffered drops in the amount of time people stay tuned in for compared with the same period last year.
| Ending Sep 09 | Ending Dec 09 | Ending Mar 10 | Ending Jun 10 | Ending Sep 10 | YoY % Change Sep 09 vs Sep 10 | QoQ % Change Jun 10 vs Sep 10 | |
|---|---|---|---|---|---|---|---|
| All Radio | 22.1 | 21.5 | 21.8 | 22.0 | 22.6 | 2.3 | 2.7 |
| All BBC Radio | 16.5 | 16.4 | 16.4 | 16.3 | 16.7 | 1.2 | 2.5 |
| All BBC Network Radio | 15.6 | 15.4 | 15.3 | 15.2 | 15.4 | -1.3 | 1.3 |
| All Commercial Radio | 13.7 | 13.4 | 13.0 | 13.5 | 13.7 | 0.0 | 1.5 |
| All Local Commercial Radio (National TSA) | 12.7 | 12.6 | 12.1 | 12.4 | 12.6 | -0.8 | 1.6 |
| BBC Local Radio | 9.7 | 9.5 | 9.4 | 9.4 | 10.3 | 6.2 | 9.6 |
| All National Commercial Radio | 8.1 | 7.9 | 7.6 | 7.8 | 7.9 | -2.5 | 1.3 |
| Other Radio | 6.8 | 7.2 | 6.5 | 6.9 | 7.6 | 11.8 | 10.1 |
Source: RAJAR
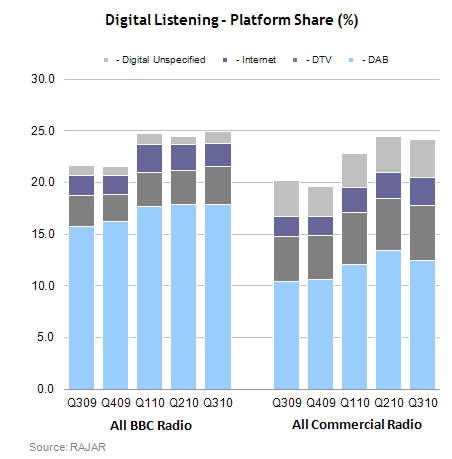
Platform Share
MediaTel has PowerPoint presentations available to download, featuring pre-prepared market breakdown graphs for the RAJAR data release – click here.