
59% of the population now listens to digital radio each week, with 32 million of those tuning in via a digitally enabled receiver (DAB, DTV, online).
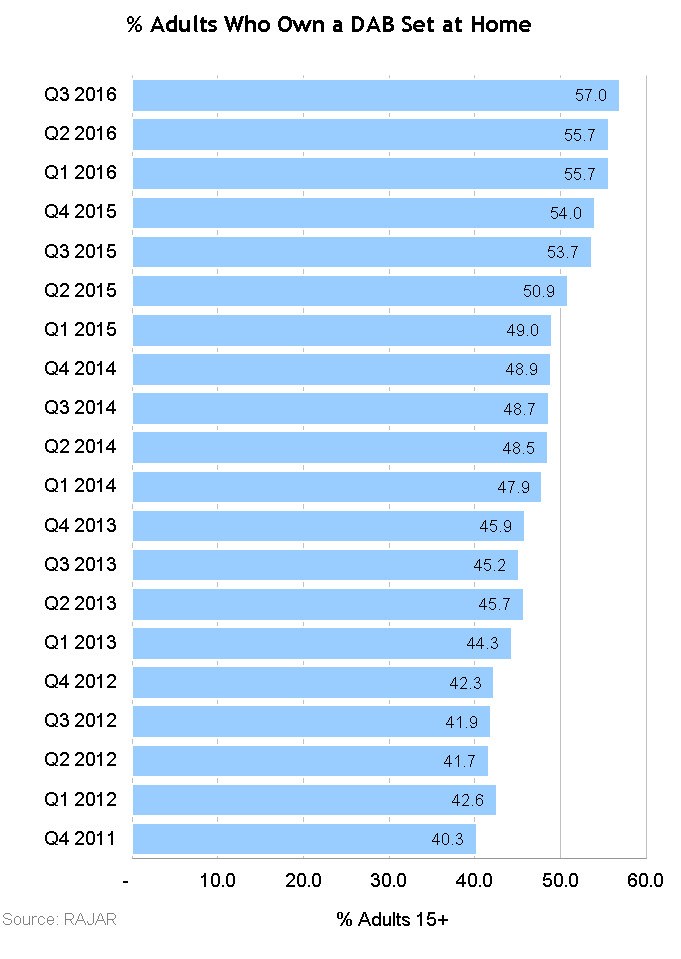
The latest figures from Rajar show that the share of all radio listening via a digital platform stood at 45.5% in Q3 – comprised of DAB (32.3%), DTV (5.2%) and listening online or via an app (8%).
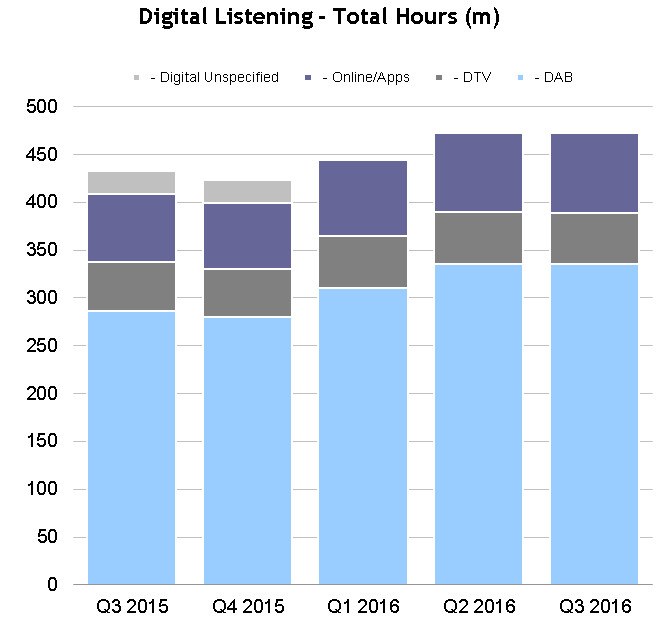
In an average week, digital listening accounted for 472 million hours; DAB has a 71% share, DTV 11% and online 18%.
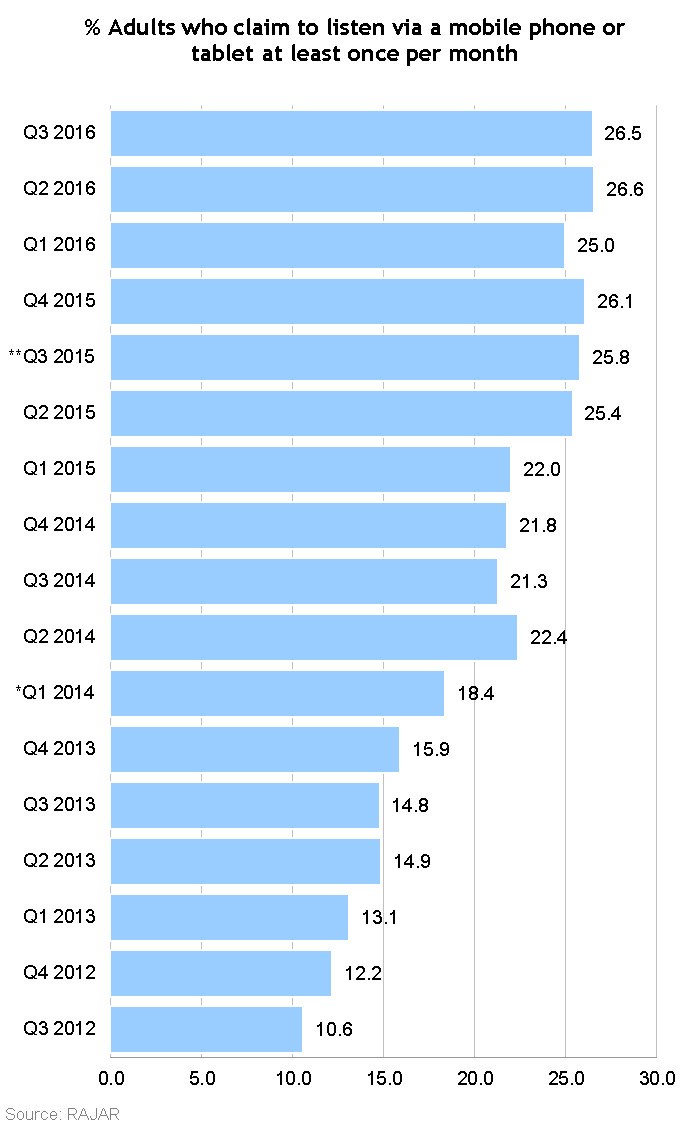
27% claim to listen to the radio via a mobile phone or tablet at least once per month, rising to 37% of 15-24 year olds.
Overall, 48.2 million (89%) of the adult (15+) UK population tuned in to their selected radio stations each week, listening to an average of 21.5 hours of live radio (a total of 1.038 billion hours).
| AM/FM | All Digital | – DAB | – DTV | – Online/Apps | – Digital Unspecified | |
|---|---|---|---|---|---|---|
| Platform Shares (%) | ||||||
| Q3 2015 | 50.4 | 41.9 | 27.7 | 5.0 | 6.9 | 2.3 |
| Q4 2015 | 50.7 | 41.7 | 27.7 | 5.0 | 6.8 | 2.3 |
| Q1 2016 | 55.9 | 44.1 | 30.9 | 5.4 | 7.8 | n/a |
| Q2 2016 | 54.7 | 45.3 | 32.2 | 5.1 | 8.0 | n/a |
| Q3 2016 | 54.5 | 45.5 | 32.3 | 5.2 | 8.0 | n/a |
| Digital Listening Weekly Reach (%) | ||||||
| Q3 2015 | n/a | 56.1 | 39.2 | 14.4 | 16.8 | 9.0 |
| Q4 2015 | n/a | 56.1 | 38.6 | 14.5 | 16.4 | 9.3 |
| Q1 2016 | n/a | 56.9 | 42.3 | 14.9 | 18.1 | n/a |
| Q2 2016 | n/a | 58.9 | 44.8 | 14.9 | 19.3 | n/a |
| Q3 2016 | n/a | 59.0 | 44.8 | 14.7 | 18.7 | n/a |
| Digital Listening Total Hours (m) | ||||||
| Q3 2015 | n/a | 433.0 | 286.0 | 52.0 | 71.0 | 24.0 |
| Q4 2015 | n/a | 423.0 | 280.0 | 50.0 | 69.0 | 24.0 |
| Q1 2016 | n/a | 444.0 | 310.0 | 55.0 | 79.0 | n/a |
| Q2 2016 | n/a | 473.0 | 336.0 | 54.0 | 83.0 | n/a |
| Q3 2016 | n/a | 472.0 | 336.0 | 53.0 | 83.0 | n/a |
Source: RAJAR
Note: **As of Q1 2016 a Platform Attribution model has been applied to the data which eliminates any ”unspecified”