The latest RAJAR figures for Q4 2011 saw All Radio’s reach dip, taking it below the 47 million listener mark, which it hit for the first time ever in Q1 2011.
All Radio’s figures peaked in Q2 2011 – hitting a high of 47.6 million, though it fell to 47.1 million in Q3. In the last three months of the year, All Radio posted a -1.0% drop QoQ to 46.7 million listeners.
All Commercial Radio also suffered a set-back in Q4, falling below the 33 million mark after a -2.7% decline. It also recorded a -0.7% drop on Q4 2010.
Weekly Reach
All BBC Radio and BBC Local Radio increased their reach during the fourth quarter (up 0.2 and 1.1% QoQ respectively). The positive figures for BBC Local Radio come a week after Lord Patten’s call for the BBC to protect its local radio output. The BBC had planned to cut £15 million from its local radio budget and reduce its workforce by 280 people.
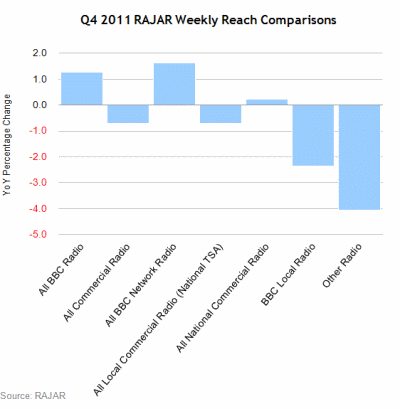
All BBC Radio also enjoyed a 1.3% YoY rise, as did All National Commercial Radio (up 0.2%). National Commercial Radio is still benefiting from the successful roll-out of national brands including Heart, Smooth and Capital. Over the year, All Local Commercial also appears to be holding up a bit better than BBC Local Radio, with just a -0.7% YoY dip compared to the BBC’s -2.4%.
All Commercial Radio now has a weekly reach of 32.8 million, while the BBC’s reach sits at 34.9 million.
| Ending Dec 10 | Ending Mar 11 | Ending Jun 11 | Ending Sep 11 | Ending Dec 11 | QoQ % Change Sep 11 vs Dec 11 | YoY % Change Dec 10 vs Dec 11 | |
|---|---|---|---|---|---|---|---|
| All Radio | 46,727 | 47,266 | 47,616 | 47,137 | 46,677 | -1.0 | -0.1 |
| All BBC Radio | 34,505 | 35,074 | 35,530 | 34,863 | 34,940 | 0.2 | 1.3 |
| All Commercial Radio | 33,059 | 34,046 | 34,021 | 33,719 | 32,821 | -2.7 | -0.7 |
| All BBC Network Radio | 31,128 | 31,889 | 32,108 | 31,723 | 31,635 | -0.3 | 1.6 |
| All Local Commercial Radio (National TSA) | 26,462 | 27,305 | 27,289 | 27,036 | 26,275 | -2.8 | -0.7 |
| All National Commercial Radio | 15,407 | 15,943 | 16,166 | 15,573 | 15,441 | -0.8 | 0.2 |
| BBC Local Radio | 9,836 | 10,197 | 9,645 | 9,499 | 9,604 | 1.1 | -2.4 |
| Other Radio | 3,061 | 3,255 | 3,238 | 3,062 | 2,937 | -4.1 | -4.1 |
Source: RAJAR
Share of Listening
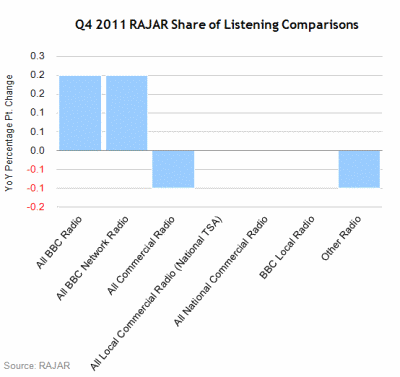
Commercial radio saw its share of listening fall in Q4 – down 0.9% QoQ and -0.1% YoY. The BBC posted more positive results, up 1.0% QoQ and 0.2% YoY.
All Commercial Radio now has a 42.4% share compared to the BBC’s 55.5% share.
| Ending Dec 10 | Ending Mar 11 | Ending Jun 11 | Ending Sep 11 | Ending Dec 11 | QoQ % Point Change Sep11 vs Dec 11 | YoY % Point Change Dec 10 vs Dec 11 | |
|---|---|---|---|---|---|---|---|
| All Radio | 100.0 | 100.0 | 100.0 | 100.0 | 100.0 | 0 | 0 |
| All BBC Radio | 55.3 | 55.0 | 54.0 | 54.5 | 55.5 | 1.0 | 0.2 |
| All BBC Network Radio | 46.4 | 46.2 | 45.4 | 46.1 | 46.6 | 0.5 | 0.2 |
| All Commercial Radio | 42.5 | 42.6 | 43.7 | 43.3 | 42.4 | -0.9 | -0.1 |
| All Local Commercial Radio (National TSA) | 30.6 | 31.0 | 31.5 | 31.8 | 30.6 | -1.2 | 0 |
| All National Commercial Radio | 11.8 | 11.7 | 12.2 | 11.5 | 11.8 | 0.3 | 0 |
| BBC Local Radio | 8.9 | 8.8 | 8.6 | 8.3 | 8.9 | 0.6 | 0 |
| Other Radio | 2.2 | 2.4 | 2.3 | 2.2 | 2.1 | -0.1 | -0.1 |
Source: RAJAR
Average Hours Per Listener
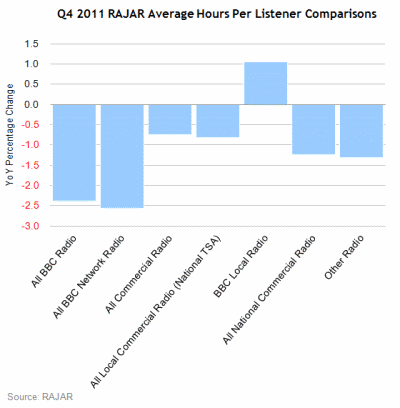
In line with the decline in weekly reach, people listened to the radio for less time in Q4. All Radio’s average hours per listener fell -3.1% QoQ to 22.1 per week.
All BBC Radio and All Commercial Radio were both down, -.2.4% and -3.6% respectively.
BBC Local Radio was the only group in our analysis to see its average hours increase during the last three months of 2011. Its average hours were up 2.1% QoQ (and 1.1% YoY) to 9.6 per week.
| Ending Dec 10 | Ending Mar 11 | Ending Jun 11 | Ending Sep 11 | Ending Dec 11 | QoQ % Change Sep 11 vs Dec 11 | YoY % Change Dec 10 vs Dec 11 | |
|---|---|---|---|---|---|---|---|
| All Radio | 22.4 | 22.4 | 22.6 | 22.8 | 22.1 | -3.1 | -1.3 |
| All BBC Radio | 16.8 | 16.6 | 16.4 | 16.8 | 16.4 | -2.4 | -2.4 |
| All BBC Network Radio | 15.6 | 15.3 | 15.2 | 15.6 | 15.2 | -2.6 | -2.6 |
| All Commercial Radio | 13.4 | 13.3 | 13.8 | 13.8 | 13.3 | -3.6 | -0.7 |
| All Local Commercial Radio (National TSA) | 12.1 | 12.0 | 12.4 | 12.7 | 12.0 | -5.5 | -0.8 |
| BBC Local Radio | 9.5 | 9.2 | 9.6 | 9.4 | 9.6 | 2.1 | 1.1 |
| All National Commercial Radio | 8.0 | 7.7 | 8.1 | 7.9 | 7.9 | 0 | -1.3 |
| Other Radio | 7.6 | 7.7 | 7.6 | 7.8 | 7.5 | -3.8 | -1.3 |
Source: RAJAR
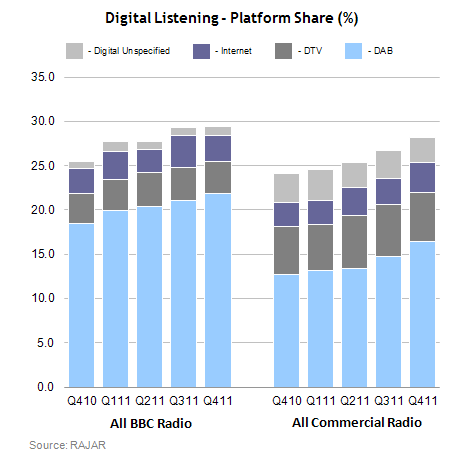
MediaTel has PowerPoint presentations available to download, featuring pre-prepared market breakdown graphs for the RAJAR data release – click here.