


How much OOH reach in conurbations is people who don’t live there?

Opinion
People travel far from their home base as part of their daily routine. Ruth Chalisey looks at the latest Route journey data with advertising opportunities in mind.
Sometimes, audience data reinforces findings that we intuitively understand but rarely quantify. One of these is that OOH is a medium built on movement. Campaigns aren’t confined to static populations; they are experienced by people travelling to work or education, for shopping, or leisure.
On my own journey from Finchley into Central London, I move through multiple boroughs before 9am. My brother lives in a village near Stockport but regularly travels to London for work, passing through multiple counties. The frames we each pass on our journeys aren’t “local” to us, yet they contribute to campaign reach all the same. That pattern is replicated at scale across the country.
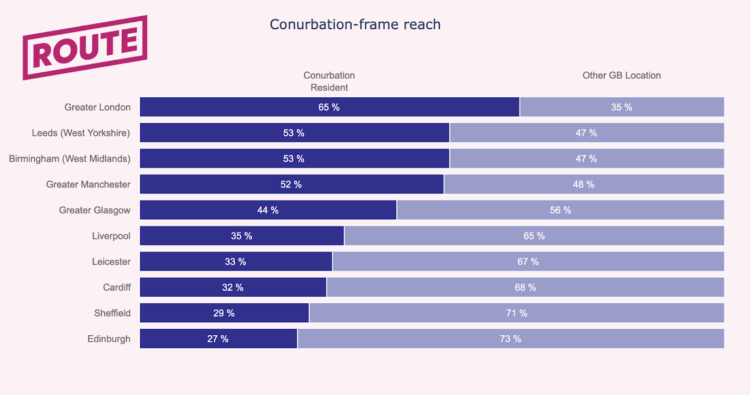
Even in Greater London, where the proportion of reach from residents is the highest – unsurprising given its scale and density – around a third of reach comes from beyond the capital, reflecting the inflow of commuters and visitors each day.
Source: Route Research 2026
It’s one thing to observe this dynamic in London, but it’s another to see how it plays out in other regions, which can be structured very differently.
West Yorkshire offers a compelling case study. Rather than radiating from a single centre, it’s shaped by the coming together of several sizeable urban areas – most notably the cities of Leeds, Bradford and Wakefield.
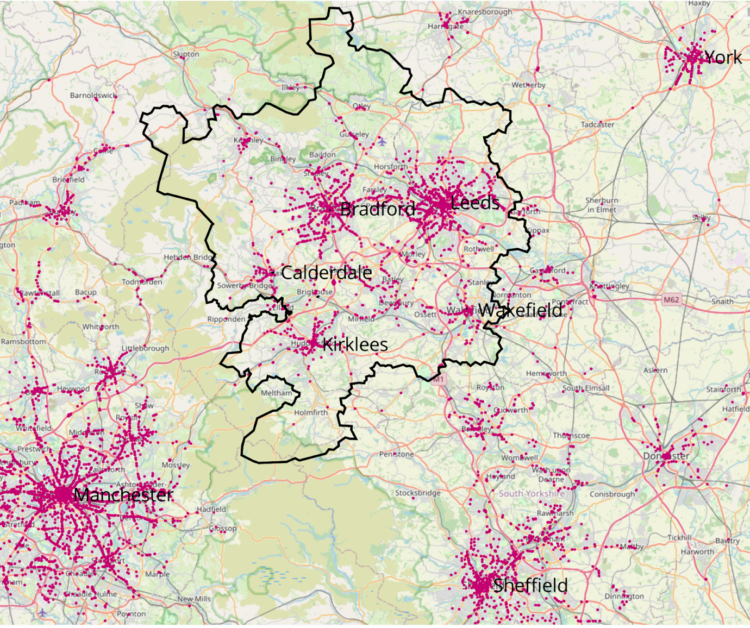
With 7,000+ OOH frames measured in Route across the conurbation, the clustering of its inventory reflects the multi-centred character of the conurbation.
This map shows the geographic distribution of over 7,000 OOH posters and screens measured in Route across the conurbation; the clustering of the inventory reflects its multi-centred character. It also illustrates its proximity to OOH inventory in other key urban centres, notably Manchester and Sheffield.
Source: Route Research 2026
The question then is not simply how much reach those frames deliver, but where that reach originates, and how daily movement between these cities amplifies campaign exposure.
The development of the new Route solution is giving us access to new third-party datasets, including O2 Motion’s anonymised and aggregated origin-destination mobile data product that will feed directly into our modelling.
Having access to this level of insight has allowed the Route team to explore audience flows in greater depth. We’ve been analysing the data to better understand how daily journeys shape OOH exposure – and the findings reinforce just how interconnected our cities and towns are.
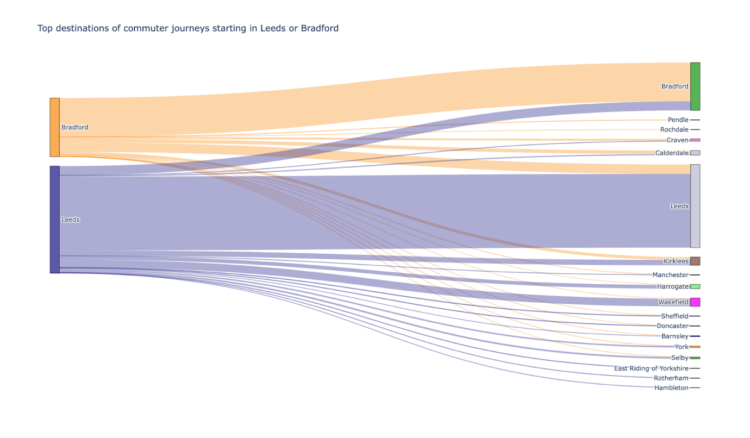
In West Yorkshire, for example, 68% of commute journeys starting in Leeds remain within the local authority.
But just over a fifth (22%) travel to other parts of the conurbation – most commonly Bradford and Wakefield – with similar proportions also flowing in the opposite direction during peak hours.
Source: Route analysis of O2 Motion’s Origin Destination product
The diagram above shows where commuter journeys that start in Leeds or Bradford end up. The width of each flow shows the number of travellers, allowing you to see at a glance which destinations attract the most travel, from journeys that stay within the two cities, to those reaching other parts of West Yorkshire and nearby areas of Manchester, York and Sheffield.
Check out an interactive version of the diagram to explore the flow of journeys; you can hover over each flow to see the percentage of journeys it represents.
The same data also highlights the wider catchment areas of major cities. Central London, for example, appears among the top destinations for commuter journeys starting in Brighton and Cambridge. These flows illustrate how audiences often travel considerable distances for work, extending the reach of urban OOH far beyond the city’s boundaries.
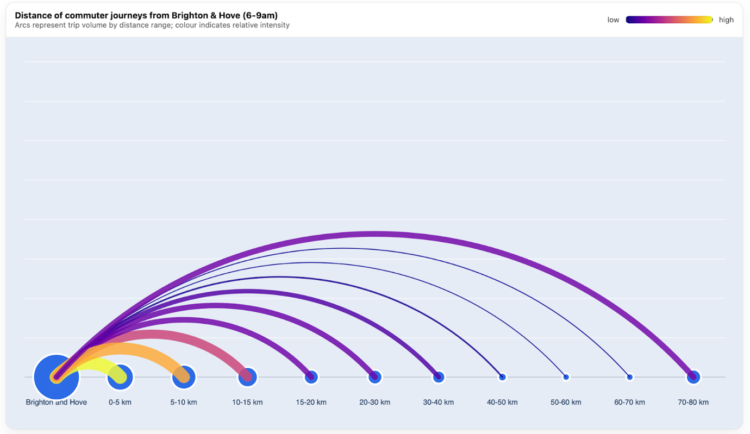
The distances involved can be significant. The diagram below shows the journeys made by commuters originating in Brighton and Hove during the morning peak (7-9 am), with the width of each line indicating the number of trips at different distances. It highlights that commutes of 70-80km from Brighton are not uncommon, underlining how far people may travel from their home base as part of their daily routines.
Source: Route analysis of O2 Motion’s Origin Destination product
Why does this matter for advertisers? These patterns of movement create repeated opportunities for campaigns to be seen.
When people travel regularly between neighbouring cities or across wider regions, they are exposed to OOH frames along those journeys as well as within their destination. A campaign running across multiple locations, therefore, doesn’t simply extend reach geographically; it increases the likelihood that the same people are exposed to the campaign more than once.
That matters because frequency plays an important role in advertising effectiveness. Research consistently shows that repeated exposure strengthens brand impact.
Work by Havas and Lumen, for example, demonstrates that attention accumulates across exposures, with each additional exposure contributing to greater overall attention to the campaign.
Other research has explored how frequency influences emotional response to advertising. A study by WPP Media and Gorilla in the Room found that positive emotional response to OOH advertising increased as exposure rose, peaking at around nine to twelve exposures before beginning to level off.
Taken together, these findings reinforce the importance of understanding how people move through the environments where OOH is present. Those journeys help explain how campaign exposures accumulate in the real world.
From a planning perspective, understanding these journeys also enables greater targeting capabilities. If an advertiser wants to reach people shopping in central London, the most effective OOH locations may not be limited to the city itself – commuter hubs such as Brighton or Cambridge may also play an important role.
The same logic applies to measuring campaign outcomes. If people are exposed to OOH advertising while travelling or working in one place, the resulting purchase may occur elsewhere, often closer to home. Limiting outcome measurement only to residents of the city where the advertising is placed risks missing part of the campaign’s true impact.
Maybe think of it like this. If two hundred people are at your Council’s public meeting on street lighting, most of them are locals; if two hundred people attend a wedding, by contrast, many will have come from elsewhere. Route data can begin to tell you where.
Explore West Yorkshire (and more) in the latest Route release
To explore OOH frames in West Yorkshire and other conurbations in more detail, you can access the latest Route data (Q1 2026) via our interactive dashboard here.
 Ruth Chalisey is the director of research at Route Research