


Channel 5 has had another bumper month in terms of revenue, up 41.7% compared to this time last year.
The broadcaster saw revenues drop between July to December 2010 after it was sold to Richard Desmond for £103.5 million.
However, it has enjoyed a good start to 2011, with revenues up by 16.6% YoY in February and by 22.4% YoY in March.
ITV1 also posted an increase in April, up 5.0% YoY, while ITV Breakfast saw an 11.1% rise.
Channel 4, meanwhile, recorded a small 2.3% YoY increase in revenues – an improvement on its 4.6% YoY drop in February and a 0.2% decline in March.
Overall, terrestrial revenue was up 7.8% during the month, while total satellite was up 21.1% YoY.
“April appears to be around 8% up on 2010 in terms of revenue. The big drivers of this appear to be Sky, BT, Asda and KFC,” according to PHD’s Oliver Jones.
“In a month of so many Bank Holidays, revenue was predicted to be up from the start of the year, but perhaps did not reach the heights that some expected.
“In general, supermarkets saw increased budgets year on year, but other than Asda, their % growth was not as high as forecasted. Surprisingly, big advertisers such as Procter & Gamble and B&Q saw a diminished spend in April vs 2010, at -16% and -36% respectively.”
Network Revenue
| Total Revenue | Apr 10 | Apr 11 | % Change |
|---|---|---|---|
| ITV1 | 108,960,000 | 114,410,000 | 5.0 |
| C4 | 49,370,000 | 50,500,000 | 2.3 |
| Five | 16,720,000 | 23,690,000 | 41.7 |
| ITV Breakfast | 4,680,000 | 5,200,000 | 11.1 |
| Total Terrestrial (inc. ITV Breakfast | 179,730,000 | 193,800,000 | 7.8 |
| Total Satellite | 97,890,000 | 118,520,000 | 21.1 |
Source: Agency Estimates
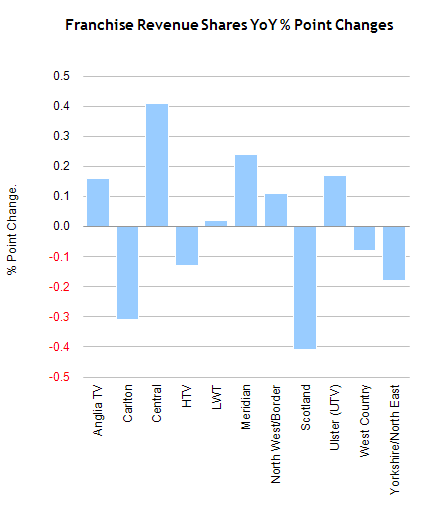
ITV Franchise Area
| % Share of ITV Revenue by Franchise | Apr 10 | Apr 11 | % Point Change |
|---|---|---|---|
| Anglia TV | 7.63 | 7.79 | 0.16 |
| Carlton | 14.06 | 13.75 | -0.31 |
| Central | 15.31 | 15.72 | 0.41 |
| HTV | 6.60 | 6.47 | -0.13 |
| LWT | 11.76 | 11.78 | 0.02 |
| Meridian | 11.73 | 11.97 | 0.24 |
| North West/Border | 10.43 | 10.54 | 0.11 |
| Scotland | 6.94 | 6.53 | -0.41 |
| Ulster (UTV) | 2.46 | 2.63 | 0.17 |
| West Country | 2.03 | 1.95 | -0.08 |
| Yorkshire/North East | 11.06 | 10.88 | -0.18 |
Network CPTs
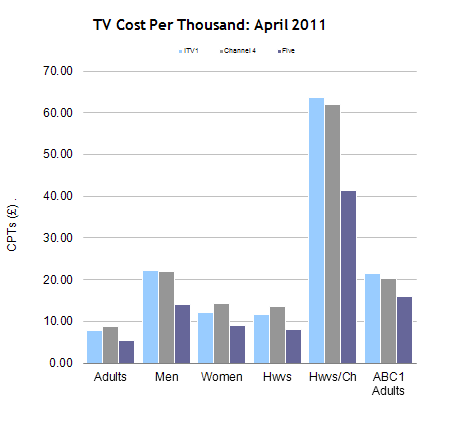
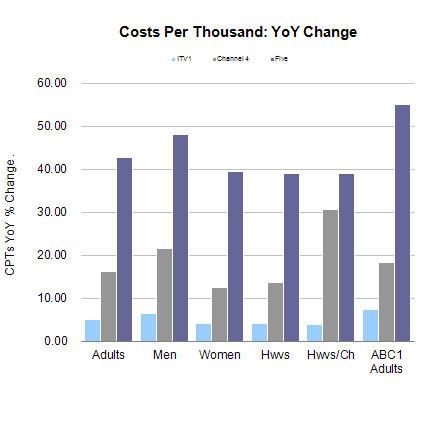
| CPTs | Adults | Men | Women | Hwvs | Hwvs/Ch | ABC1 Adults |
|---|---|---|---|---|---|---|
| ITV1 | 7.87 | 22.22 | 12.19 | 11.64 | 63.60 | 21.35 |
| % Ch YoY | 4.95 | 6.51 | 4.10 | 4.07 | 3.74 | 7.22 |
| Channel 4 | 8.65 | 21.96 | 14.27 | 13.53 | 61.95 | 20.22 |
| % Ch YoY | 16.06 | 21.47 | 12.54 | 13.60 | 30.56 | 18.35 |
| Five | 5.47 | 14.01 | 8.98 | 7.97 | 41.33 | 16.03 |
| % Ch YoY | 42.78 | 48.03 | 39.42 | 38.93 | 39.00 | 55.06 |
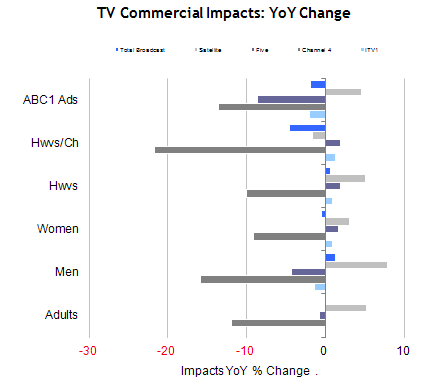
Commercial Impacts
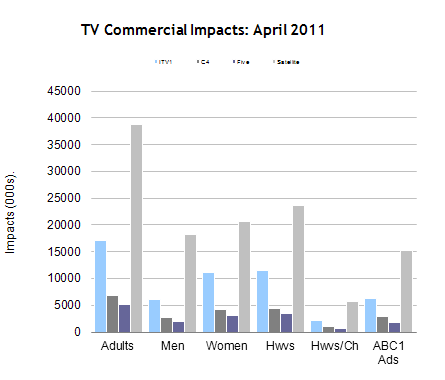
| Impacts | Adults | Men | Women | Hwvs | Hwvs/Ch | ABC1 Adults |
|---|---|---|---|---|---|---|
| ITV1 | 17,098.87 | 6,059.08 | 11,039.78 | 11,564.45 | 2,116.40 | 6,303.14 |
| % Ch YoY | 0.04 | -1.41 | 0.86 | 0.88 | 1.25 | -2.06 |
| C4 | 6,868.92 | 2,705.59 | 4,163.32 | 4,390.72 | 959.10 | 2,938.96 |
| % Ch YoY | -11.86 | -15.78 | -9.11 | -9.95 | -21.62 | -13.56 |
| Five | 5,093.98 | 1,988.71 | 3,105.26 | 3,498.89 | 674.34 | 1,738.60 |
| % Ch YoY | -0.76 | -4.28 | 1.62 | 1.98 | 1.93 | -8.62 |
| Satellite | 38,707.65 | 18,142.76 | 20,564.87 | 23,545.29 | 5,653.59 | 15,139.45 |
| % Ch YoY | 5.26 | 7.88 | 3.05 | 5.17 | -1.61 | 4.58 |
| Total Broadcast | 67,414.07 | 28,640.12 | 38,773.94 | 42,875.74 | 9,359.66 | 25,891.26 |
| % Ch YoY | 0.21 | 1.24 | -0.53 | 0.64 | -4.55 | -1.83 |
TV market data is available in mediatel.co.uk’s TV Database.





