
The ongoing recession is still causing problems for the television market, with all stations recording year on year falls in their revenue totals. The worst hit was Five, with revenue down by 31.5% on April 2008.
Following closely behind was Channel 4, with a fall of 25.3%. The broadcaster, which is trying to secure a tie-up with BBC Worldwide that would generate a reported £800 million (see BBC Worldwide/C4 tie-up would generate £800 million turnover), received £14 million commercial revenue compared to last year.
ITV1, who recently announced a further £40 million reduction in costs (see ITV to cut another £40m in costs), saw its monthly revenue fall by 18.3% against 2008’s total. Meanwhile ITV1 breakfast franchise GMTV’s revenue shrank by 16.9%, to stand at £4.1 million for the month.
Total Satellite’s revenue total decreased by 14.9% compared to April 2008’s figures, standing at £81.3 million.
| Total Revenue | Apr 08 | Apr 09 | % Change |
| ITV1 | 110,550,000 | 90,270,000 | -18.3 |
| C4 | 55,500,000 | 41,450,000 | -25.3 |
| Five | 24,390,000 | 16,710,000 | -31.5 |
| GMTV | 5,030,000 | 4,180,000 | -16.9 |
| Total Terrestrial (inc. GMTV) | 195,470,000 | 152,610,000 | -21.9 |
| Total Satellite | 95,540,000 | 81,300,000 | -14.9 |
| Source: Agency Estimates | |||
ITV Franchises
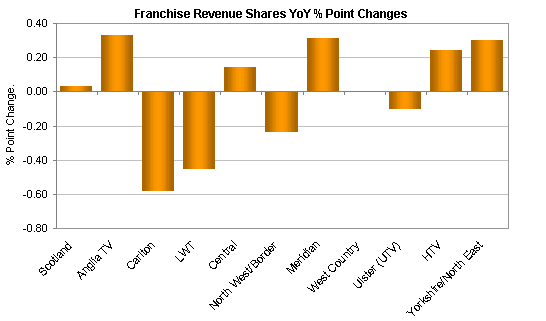
According to our agency estimates, Central has leapfrogged Carlton to provide the greater share of ITV1 revenue. The Midlands franchise area accounted for 15.73% of the network’s revenue, up by 0.14 percentage points year on year.
Last month’s leader Carlton now finds itself responsible for a 15.21% share. The London weekday franchise area saw its share fall by 0.58 percentage points compared to April 2008.
Westcountry provided the smallest share of ITV1’s revenue, with 2.07% of the network’s total income (unchanged on last year’s figures).
| % Share of ITV Revenue by Franchise | Apr 08 | Apr 09 | % Point Change |
| Scotland | 6.63 | 6.66 | 0.03 |
| Anglia TV | 7.09 | 7.42 | 0.33 |
| Carlton | 15.79 | 15.21 | -0.58 |
| LWT | 11.49 | 11.04 | -0.45 |
| Central | 15.59 | 15.73 | 0.14 |
| North West/Border | 10.55 | 10.32 | -0.23 |
| Meridian | 11.41 | 11.72 | 0.31 |
| West Country | 2.07 | 2.07 | 0.00 |
| Ulster (UTV) | 2.86 | 2.76 | -0.10 |
| HTV | 6.13 | 6.37 | 0.24 |
| Yorkshire/North East | 10.40 | 10.70 | 0.30 |
Costs Per Thousand
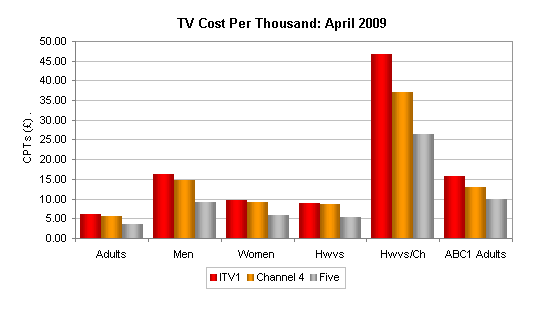
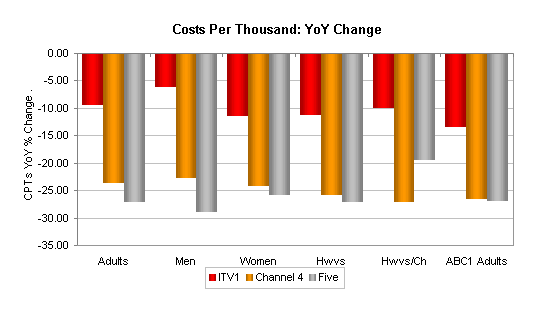
Cost per thousands were cheaper across the board for ITV1’s among Mediatel’s featured audiences for April 2009. ABC1 Adults attained the greatest percentage decrease, down by 13.3% year on year (to cost £15.8).
Channel 4 also had across the board reductions for our featured audiences. This time however it was Housewives with Children that fell the most in price, down by 27% to cost £37.16.
Continuing the trend of the other two terrestrial broadcasters, Five’s CPT price fell for our audiences. The biggest CPT dip was seen amongst the Men audience now costing £9.01, 28.8% cheaper compared to April 2008.
| CPTs | Adults | Men | Women | Hwvs | Hwvs/Ch | ABC1 Adults |
| ITV1 | 6.01 | 16.25 | 9.54 | 8.95 | 46.76 | 15.80 |
| % Ch YoY | -9.3 | -6.1 | -11.3 | -11.0 | -9.9 | -13.3 |
| Channel 4 | 5.67 | 14.62 | 9.26 | 8.61 | 37.16 | 13.05 |
| % Ch YoY | -23.5 | -22.6 | -24.0 | -25.7 | -27.0 | -26.4 |
| Five | 3.55 | 9.01 | 5.86 | 5.30 | 26.40 | 9.99 |
| % Ch YoY | -26.9 | -28.8 | -25.7 | -27.0 | -19.3 | -26.8 |
Commercial Impacts
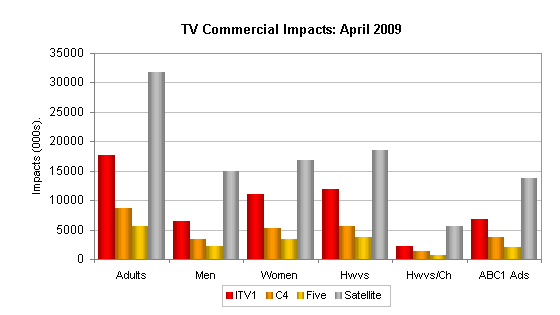
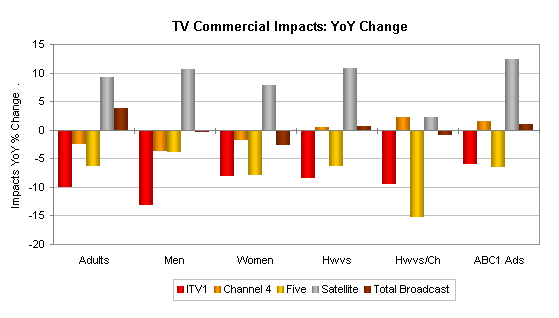
All of our featured audiences fell for ITV1 amongst commercial impacts. The worst performance can from the Men audience, slipping by 13% on April 2008’s total.
As was the case last month, Channel 4 had mixed fortunes, with impacts falling for half of our featured audiences during April 2008. The audience that increased most year on year was Housewives with Children, which rose by 2.3%.
Five’s commercial impacts fell across all of our featured audiences during April 2009. The biggest drop was seen amongst Housewives with Children audience, down by 15.2% year on year.
Total Broadcast saw commercial impacts for half of our featured audience decline year on year. Amongst the audiences to increase, ABC1 Adults had the best performance (one percent higher than.April 2008’s total).
| Impacts | Adults | Men | Women | Hwvs | Hwvs/Ch | ABC1 Adults |
| ITV1 | 17,664 | 6,536 | 11,128 | 11,866 | 2,271 | 6,724 |
| % Ch YoY | -9.9 | -13.0 | -8.0 | -8.2 | -9.4 | -5.9 |
| C4 | 8,605 | 3,336 | 5,268 | 5,664 | 1,312 | 3,737 |
| % Ch YoY | -2.4 | -3.5 | -1.7 | 0.5 | 2.3 | 1.5 |
| Five | 5,534 | 2,181 | 3,353 | 3,710 | 745 | 1,968 |
| % Ch YoY | -6.2 | -3.8 | -7.8 | -6.1 | -15.2 | -6.4 |
| Satellite | 31,712 | 14,904 | 16,808 | 18,604 | 5,590 | 13,724 |
| % Ch YoY | 9.1 | 10.6 | 7.8 | 10.8 | 2.2 | 12.4 |
| Total Broadcast | 26,740 | 64,952 | 10,190 | 27,365 | 37,587 | 40,913 |
| % Ch YoY | 3.8 | -0.2 | -2.6 | 0.7 | -0.7 | 1.0 |
BARB: www.barb.co.uk