December was a good month for television, with an impressive set of viewing figures and increased revenues for all terrestrial channels.
ITV1 and ITV Breakfast posted positive rises during the Christmas month, though Channel 4 recorded the highest percentage increase in December – with revenues up 10.4% on this time last year.
Richard Desmond’s Channel 5 also put in a good performance – up 4.4% on December 2009. In November, the channel enjoyed its first revenue increase since July 2010 (up 6.1% YoY).
Overall, total terrestrial revenue was up 7.7%, while total satellite was up 17.1%.
“Revenue was up around 15% YoY across the network, completing a buoyant year for the TV advertising market,” said PHD’s Oliver Jones.
“As would be expected, FMCG and retailers were the biggest spenders, with Procter and Gamble leading the way at well over £10 million. M&S were the biggest spenders amongst retailers, with an estimated TV budget of over £7 million, an increase of over 50% on 2009. They were closely followed by Argos, Tesco and Sainsbury’s, with Argos showing a massively increased spend of over 130% year on year.
“Other big year on year increases were seen by BT, up 90%, and Nintendo, up 30%. Those advertisers who decreased spend included Iceland (-6%), Boots (-9%) and Kelloggs (-9%).”
Network Revenue
| Total Revenue | Dec 09 | Dec 10 | % Change |
|---|---|---|---|
| ITV1 | 101,690,000 | 108,780,000 | 7.0 |
| C4 | 47,380,000 | 52,330,000 | 10.4 |
| Five | 19,340,000 | 20,200,000 | 4.4 |
| ITV Breakfast | 4,000,000 | 4,290,000 | 7.3 |
| Total Terrestrial (inc. ITV Breakfast | 172,410,000 | 185,600,000 | 7.7 |
| Total Satellite | 81,630,000 | 95,620,000 | 17.1 |
Source: Agency Estimates
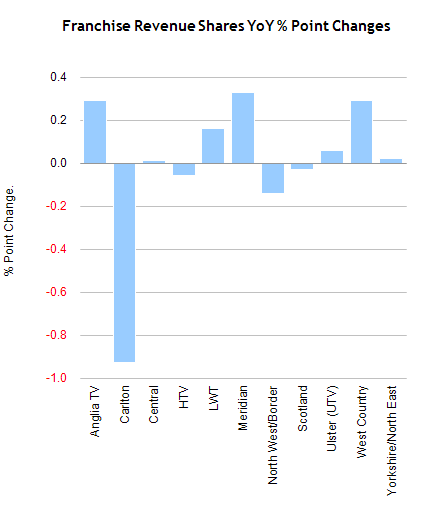
ITV Franchise Revenue
| % Share of ITV Revenue by Franchise | Dec 09 | Dec 10 | % Point Change |
|---|---|---|---|
| Anglia TV | 7.39 | 7.68 | 0.29 |
| Carlton | 14.18 | 13.25 | -0.93 |
| Central | 15.81 | 15.82 | 0.01 |
| HTV | 6.38 | 6.32 | -0.06 |
| LWT | 12.00 | 12.16 | 0.16 |
| Meridian | 11.31 | 11.64 | 0.33 |
| North West/Border | 10.64 | 10.50 | -0.14 |
| Scotland | 6.97 | 6.94 | -0.03 |
| Ulster (UTV) | 2.95 | 3.01 | 0.06 |
| West Country | 1.75 | 2.04 | 0.29 |
| Yorkshire/North East | 10.61 | 10.63 | 0.02 |
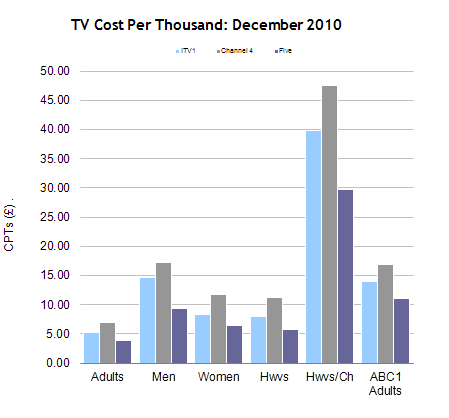
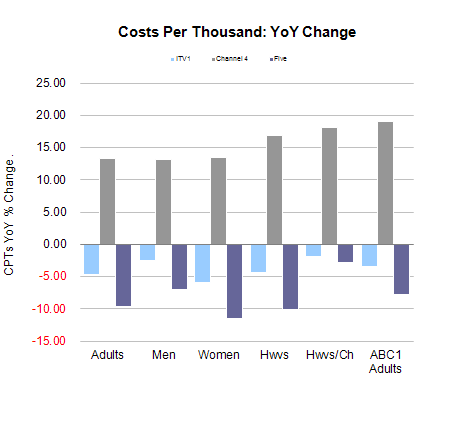
CPTs
| CPTs | Adults | Men | Women | Hwvs | Hwvs/Ch | ABC1 Adults |
|---|---|---|---|---|---|---|
| ITV1 | 5.26 | 14.56 | 8.24 | 8.00 | 39.77 | 13.99 |
| % Ch YoY | -4.73 | -2.49 | -5.99 | -4.39 | -1.96 | -3.44 |
| Channel 4 | 6.98 | 17.29 | 11.71 | 11.26 | 47.51 | 16.80 |
| % Ch YoY | 13.31 | 13.21 | 13.38 | 16.80 | 18.16 | 19.08 |
| Five | 3.81 | 9.25 | 6.48 | 5.70 | 29.63 | 11.04 |
| % Ch YoY | -9.61 | -6.98 | -11.46 | -10.16 | -2.83 | -7.73 |
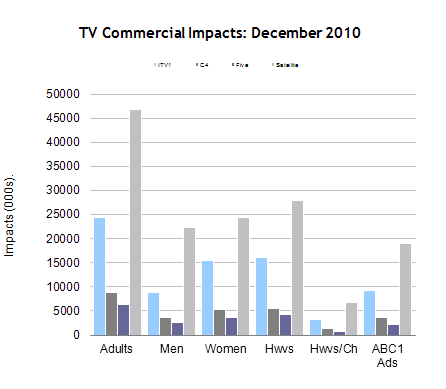
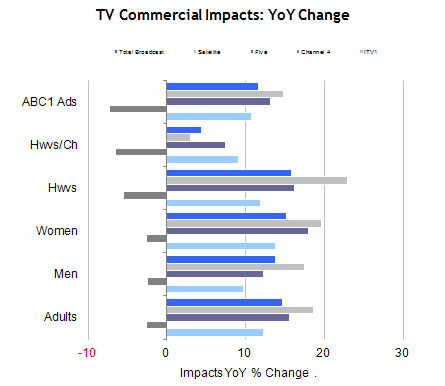
Commercial Impacts
| Impacts | Adults | Men | Women | Hwvs | Hwvs/Ch | ABC1 Adults |
|---|---|---|---|---|---|---|
| ITV1 | 24,323.46 | 8,789.53 | 15,533.93 | 16,006.08 | 3,218.33 | 9,146.97 |
| % Ch YoY | 12.27 | 9.70 | 13.79 | 11.88 | 9.10 | 10.78 |
| C4 | 8,819.20 | 3,560.63 | 5,258.56 | 5,465.93 | 1,295.89 | 3,665.33 |
| % Ch YoY | -2.52 | -2.42 | -2.58 | -5.43 | -6.52 | -7.24 |
| Five | 6,238.76 | 2,569.46 | 3,669.30 | 4,169.62 | 802.13 | 2,152.70 |
| % Ch YoY | 15.55 | 12.28 | 17.96 | 16.26 | 7.49 | 13.19 |
| Satellite | 46,759.56 | 22,306.08 | 24,453.47 | 27,870.43 | 6,671.10 | 18,980.10 |
| % Ch YoY | 18.61 | 17.45 | 19.69 | 22.93 | 3.00 | 14.83 |
| Total Broadcast | 88,342.29 | 38,005.72 | 50,336.56 | 54,970.99 | 12,382.11 | 34,858.18 |
| % Ch YoY | 14.65 | 13.85 | 15.26 | 15.80 | 4.37 | 11.68 |
TV market data is available in mediatel.co.uk’s TV Database.