


Premium streaming ad views increase 27% in Europe

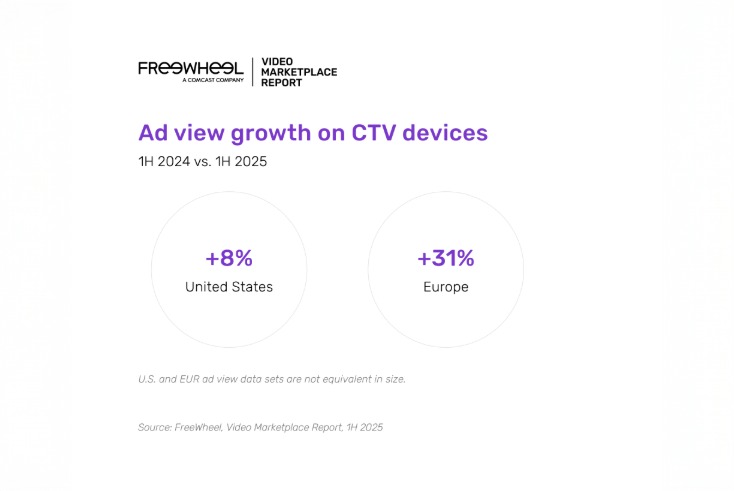
Data from FreeWheel’s latest Video Marketplace Report on monetising premium digital video, covering H1 2025, shows that ad views increased 27% year-on-year in Europe, with ad views on connected TV devices rising 31%.
Free broadcaster video on demand (BVOD) content dominates these premium streaming ad views, accounting for 76% of the total.
Programmatic ad views within premium streaming are up 44% year-on-year in Europe. As a result, programmatic now accounts for 19% of all ad views. Live content accounts for 29% of those programmatic ad views, up from 19% a year ago.
Europe’s premium streaming ad viewing is still spread across the multiscreen environment, despite the rapid increase in ad views on CTV devices. According to the report, 48% of premium streaming ad views are seen on CTV, with mobile taking a 21% share and desktop 10%, with STB VOD accounting for 21% of the ad views.
In the US, by contrast, connected TV devices dominate streaming ad consumption, accounting for 85% of total ad views in premium streaming. Mobile takes a 9% share, with desktop at 3.5% and STB VOD at 2.5%. Ad views on connected TV devices grew only 8% in the US year-on-year – far slower than what is arguably a less mature European CTV market.
If only programmatic ad views are considered, the share taken by CTV in the US falls slightly to 82% and mobile share grows to 14%. If you only consider programmatic ad views in Europe, CTV share falls noticeably to 30%, with mobile share growing to 30% and STB VOD increasing to 29%.
France drives programmatic STB VOD
The high incidence of programmatic on STB VOD in Europe is explained by the popularity of IPTV-based STB platforms in France.
Connected TV includes content shown on smart TVs and television sets connected to a streaming box or stick, gaming console or Blu-ray player. The definition of CTV in this report does not include premium streaming (of apps such as Netflix or broadcaster VOD services) through an operator (e.g. cable/satellite) set-top box. This falls under STB VOD.
Comcast defines European markets as inclusive of Belgium, Denmark, Estonia, Finland, France, Germany, Italy, Latvia, Lithuania, the Netherlands, Norway, Spain, Sweden and the UK.
The report finds that live/linear streaming takes a much higher share of all ad views in the US compared to Europe, at 56% vs 24% respectively. The reason given is higher viewing to live sport and FAST channels in the US.
Short-form premium digital video takes a slightly higher share of all ad views in the US compared to Europe, at 9% vs 6% respectively.
Premium video is much more likely to be non-guaranteed programmatic in the US than in Europe. In the US, 30% of all premium digital video ad views are programmatic (up 29% YoY) and of these, 20% are guaranteed and 80% non-guaranteed. In Europe, 19% of the ad views are programmatic and of these, 63% are guaranteed (vs 37% non-guaranteed).
Behavioural targeting accounts for most of the programmatic audience targeting in both the US (51%) and Europe (58%). Behavioural targeting is defined as targeting consumers based on their activities (e.g., shopping habits) and other non-demographic data that may be available.
Overall ad viewership grew 6% year-on-year in the US. Programmatic ad views in premium streaming were up 29% year-on-year there. That means programmatic now represents 30% of overall ad delivery in the US.
New-to-programmatic advertisers
The report found that as more programmers embrace programmatic, 14% more unique advertisers are leveraging this technology across both the markets studied. It seems that new-to-programmatic advertisers are also making a big splash; they achieved 29% more ad views than those who entered the market in the first half of 2024.
According to Emmanuel Josserand, senior director, brand, agency and industry relations at Comcast Advertising (which owns FreeWheel), programmatic helps premium video publishers capture new advertiser spend and drive more efficiency.
“The viewer experience will also benefit, as improvements in ad frequency and relevance will reduce ad fatigue, creating more engaging streaming experiences.
“There is plenty of room to further extend automated delivery across VOD and live inventory.”
The Video Marketplace Report, H1 2025, is based on aggregated advertising data collected through the FreeWheel platform. This is one of the largest data sets available on the usage and monetisation of professional, rights-managed ad-supported video content worldwide. FreeWheel works with 90% of US broadcasters and with at least one sales house (and often multiple sales houses) in the European markets covered.