Commercial terrestrial television channels saw an overall decline in yearly revenues in May, with total terrestrial down -2%, and total satellite down -0.6%.
Channel 5 was the only broadcaster to see any growth year on year, up 6.2% to a revenue of just over £25.5 million.
Channel 4 suffered the biggest revenue loss, down -7.4% on the previous year to take £45.5 million, while both ITV and ITV Breakfast saw small declines – down -1.5% and -1.8%, respectively.
Network Revenue
| Total Revenue | May 12 | May 13 | % Change |
|---|---|---|---|
| ITV1 | 116,940,000 | 115,230,000 | -1.5 |
| Channel 4 | 49,150,000 | 45,490,000 | -7.4 |
| Channel 5 | 24,020,000 | 25,520,000 | 6.2 |
| ITV Breakfast | 4,540,000 | 4,460,000 | -1.8 |
| Total Terrestrial (inc. ITV Breakfast) | 194,650,000 | 190,700,000 | -2.0 |
| Total Satellite | 135,480,000 | 134,600,000 | -0.6 |
Source: Agency Estimates
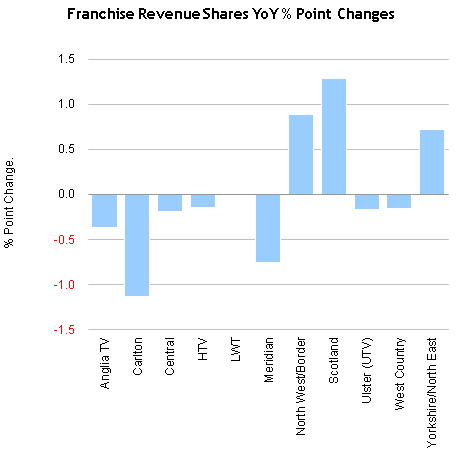
ITV Franchise Area
| % Share of ITV Revenue by Franchise | May 12 | May 13 | % Point Change |
|---|---|---|---|
| Anglia TV | 7.87 | 7.50 | -0.37 |
| Carlton | 13.26 | 12.13 | -1.13 |
| Central | 15.80 | 15.61 | -0.19 |
| HTV | 6.54 | 6.40 | -0.14 |
| LWT | 12.60 | 12.59 | -0.01 |
| Meridian | 11.93 | 11.18 | -0.75 |
| North West/Border | 10.35 | 11.24 | 0.89 |
| Scotland | 6.28 | 7.57 | 1.29 |
| Ulster (UTV) | 2.60 | 2.43 | -0.17 |
| West Country | 2.10 | 1.95 | -0.15 |
| Yorkshire/North East | 10.67 | 11.39 | 0.72 |
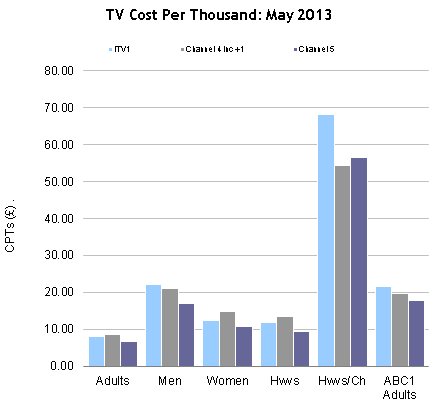
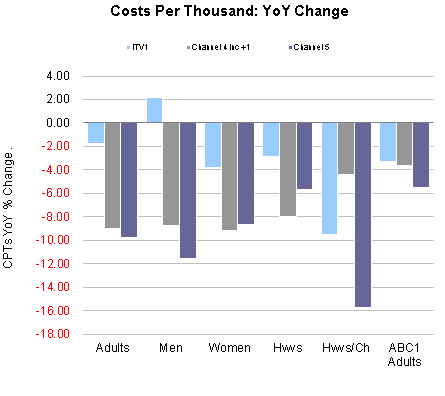
Network CPTs
| CPTs | Adults | Men | Women | Hwvs | Hwvs/Ch | ABC1 Adults |
|---|---|---|---|---|---|---|
| ITV1 | 7.98 | 22.03 | 12.50 | 11.90 | 68.15 | 21.49 |
| % Ch YoY | -1.75 | 2.13 | -3.83 | -2.89 | -9.48 | -3.33 |
| Channel 4 inc +1 | 8.66 | 21.00 | 14.73 | 13.61 | 54.44 | 19.80 |
| % Ch YoY | -8.98 | -8.72 | -9.17 | -7.97 | -4.42 | -3.65 |
| Channel 5 | 6.61 | 16.96 | 10.82 | 9.35 | 56.61 | 17.88 |
| % Ch YoY | -9.80 | -11.58 | -8.63 | -5.65 | -15.75 | -5.51 |
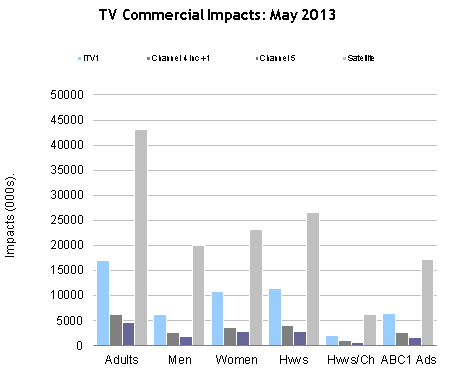
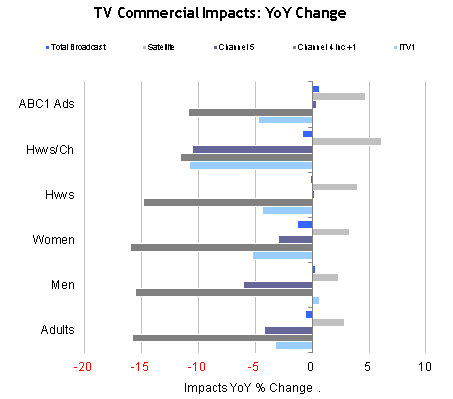
Commercial Impacts
| Impacts | Adults | Men | Women | Hwvs | Hwvs/Ch | ABC1 Adults |
|---|---|---|---|---|---|---|
| ITV1 | 16,994.71 | 6,152.41 | 10,842.28 | 11,387.61 | 1,989.27 | 6,309.29 |
| % Ch YoY | -3.18 | 0.63 | -5.23 | -4.31 | -10.80 | -4.74 |
| Channel 4 inc +1 | 6,182.10 | 2,548.71 | 3,633.40 | 3,933.04 | 983.00 | 2,703.17 |
| % Ch YoY | -15.76 | -15.51 | -15.92 | -14.82 | -11.53 | -10.82 |
| Channel 5 | 4,544.76 | 1,770.74 | 2,774.02 | 2,774.02 | 530.36 | 1,679.53 |
| % Ch YoY | -4.17 | -6.05 | -2.92 | 0.24 | -10.49 | 0.38 |
| Satellite | 43,111.96 | 19,976.61 | 23,135.21 | 26,458.55 | 6,211.38 | 17,141.51 |
| % Ch YoY | 2.88 | 2.36 | 3.33 | 3.95 | 6.10 | 4.66 |
| Total Broadcast | 72,176.13 | 30,961.63 | 41,214.36 | 45,890.36 | 9,909.44 | 28,386.52 |
| % Ch YoY | -0.58 | 0.29 | -1.24 | -0.16 | -0.84 | 0.66 |
TV market data is available in
mediatel.co.uk’s TV Database.