Nielsen: US streaming demand set to increase despite ‘cost creep’


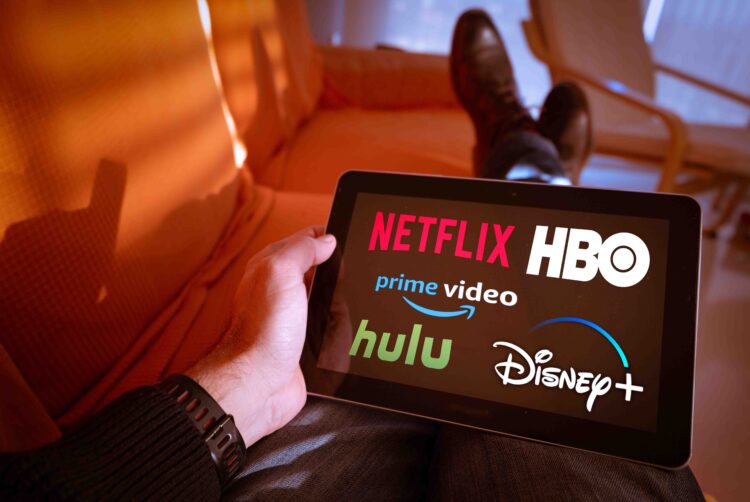
Consumers are planning to either increase or make no change to their current streaming service subscriptions, according to the latest State of Play report from Nielsen.
Whereas in 2019, a plurality of Americans only paid for one (35%) or two (33%) streaming services, today Americans are more likely to pay for more, with 18% of Americans paying for one, 24% paying for two, 23% paying for three, and 18% paying for four.
And the vast majority (93%) of Americans are either happy to increase their payment or content with their current number of subscriptions.

Meanwhile 72% of Americans reported that they “love [their] user experience with streaming services”.
However, cost creep is an increasingly salient issue as more streaming services are offered to consumers – over half (56%) of survey respondents stated that cost is the primary reason why they don’t subscribe to more services, implying that customers of better means are more likely to subscribe to more streaming services.
Perhaps reflective of that fact, consumers in the 35-49 age group spend the most money on streaming services, with 24% of households in that age bracket paying for five or more.
The report also highlighted creeping fatigue with the sheer amount of content found across various services – 46% of Americans reported that it is harder to find the video streaming content they want because there are too many streaming services available to consumers, and 64% of viewers say they wish there could be a bundled video streaming service that could simplify their consumption.
And consume Americans do – on average, Americans spend four hours and 49 minutes watching TV across different devices throughout the day, with more than half (56%) of viewership occurring through live TV.
In comparison, Britons watch three hours and 52 minutes of TV a day, with over two-thirds (68%) occurring through live TV, according to September data from Barb.
The difference highlights the significantly larger TV and streaming diet in America than in the UK.
Live TV is dominated by sports viewership – between January and September of 2021, 98% of the most viewed broadcasts were live sports, perhaps accounting for some of the difference in viewing times (US sports programs contain significantly more ad breaks than their British counterparts, with the average NFL broadcast lasting three hours and 23 minutes, containing 50 minutes of commercials (or 25% of the broadcast!)).
Meanwhile, virtual multichannel video programming distributors (vMVPDs) such as Roku, Apple TV, and YouTube TV are becoming more popular, especially with under-55s who make up 70% of households with vMVPDs.
Less than one in eight households (13%) now have these devices, nearly doubling from 7% in February of 2020.
The report also breaks down viewership numbers by identity across different television mediums. For example, white viewers make up a significantly larger number of cable (79.6%) and SVOD consumers (75.1%) than broadcast (59.5%), as opposed to Black and Hispanic/Latinx consumers who comprise 26.4% of SVOD and 16.9% of consumers on SVOD and cable, respectively, but 43.1% of broadcast viewers.
