


Brands could be spending three times too much on social. You read that right

Opinion
New analysis has found that paid social spend may be treble the optimal level for growth, while TV could be getting less credit — and cash — than it deserves.
When it comes to spending money on advertising, you’d think the big brands have it all figured out.
After all, these brands can pay significant sums to produce econometric reports that help optimise the media mix for incremental revenue or profit.
But there’s a twist in the tale.
Sure, social media gets a lot of buzz and a growing chunk of the budget (+16% globally in 2023, according to GroupM’s This Year Next Year). But new analysis would suggest spend in paid social for large brands may be treble the optimal level for growth.
And what’s potentially more interesting is that, while spend has flowed towards social platforms, for big brands at least, it looks like TV might be getting less credit — and cash — than it deserves (This Year Next Year shows spend is in decline in the US and big EU markets).
Linear TV for big brands could be delivering much more with a boost in investment, with online video also offering headroom for growth.
A guide for planners
That’s the headline conclusion of an analysis of the databank behind the revamped Media Mix Navigator (MMN) — a tool built by EssenceMediacom using data from the recent Profit Ability 2 report.
The MMN allows large brands a chance to compare their investment mix to an optimal mix based on aggregated effectiveness data from across the industry.
The dataset behind both Profit Ability 2 and the new MMN comprises 141 brands’ econometric data from the post-Covid-19 period, totalling £1.8bn of UK adspend. Data came from WPP’s GroupM (the UK’s largest media buying organisation) and media analysts Ebiquity.
Advertising generates profit, but not all media channels are equal
The MMN can produce an optimal media laydown for a brand, based on its size, category, positioning, budget, route to market, risk tolerance and payback horizon.
This helps planners guide its overall investment mix, forecasting how that spend would pay back over the short and long term.
Using this new tool, EssenceMediacom evaluated existing media mix data for large brands. It showed that marketers ought to consider cutting paid social investment — across all the brands in the study, social’s share of spend was optimised from 13% to 4%.
A common story across categories
EssenceMediacom began by looking at entire categories and their aggregate spending. By taking the total spend profile of the category and running it through the tool, planners were able to produce an optimised version of how that spend could be better deployed.
As the tool sits on the Thinkbox website, planners decided to make the scenario as tough as possible on TV to counter claims of bias.
So the payback horizon was set to short and the risk profile of the brand was set as high. Both of these factors favour addressable, digital channels. A range of values were trialled for the percentage of goods sold by the company online and offline.
We even went as far as to alter some variables that aren’t in the public-facing tool — such as over how many weeks the channel spend would be deployed in the year — to produce the most favourable result possible for non-TV channels.
Even in this ultra-friendly optimisation to social, spend across all categories was optimised from 13% to 6%.
But, across every category, and in aggregate across the entire industry, time and again the optimised mix involved large cuts to current social spend levels.
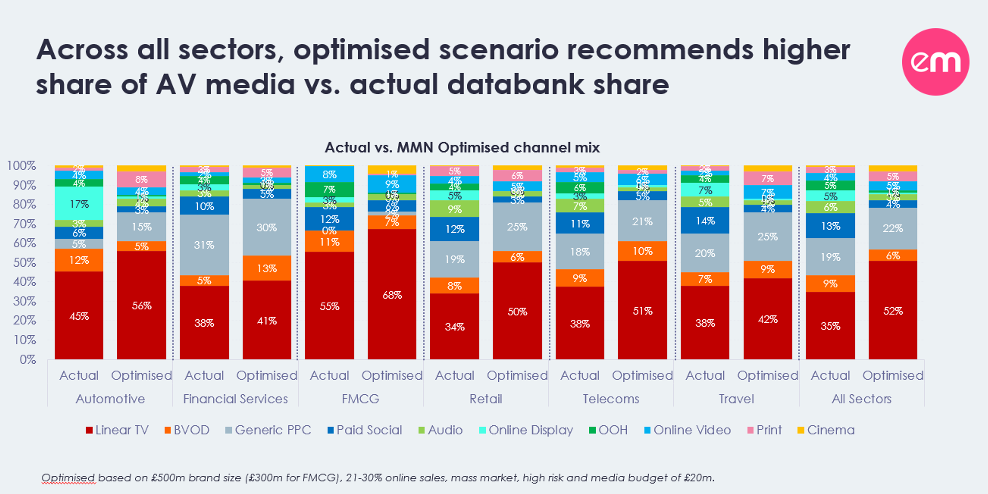
Controversially, given the prevailing sentiment in the industry over recent years, it was linear TV where the tool found advertisers were better off spending their money.
At a much lower level of spend, optimised advertising mixes also contain more cinema — the power of which was corroborated by EssenceMediacom’s other big research paper of this year, Signalling Success 2.
‘Digital up, traditional down’ is an outdated approach
Alongside social, marketers were also directed to examine their online display spend, with cuts in this channel recommended across most categories.
But online video and search were both generally channels that appear to have more headroom for investment — scotching any suggestion that the analysis itself is biased against addressable media.
These insights were found to be consistent when EssenceMediacom planners looked at individual brands and their media allocations.
For a large retailer with UK annual revenue of around £1bn, paid social had been 14% of its budget. MMN suggests this would be better off at 3%, even when optimising to a high-risk scenario.
A well-known charity brand found its media mix would work harder if it moved spend in social and display from 28% of budget to 4% while growing generic pay-per-click, TV and online video’s share of the mix.
Clearly, a brand should look at its own model and payback data first. But models that only look at one brand are a minute subset of the advertising market. So benchmarking a bespoke model against an aggregate one for an entire industry is a sensible step. Warc data shows only 4% of advertisers are trying to calibrate or verify their brand’s model.
The MMN tool can also help brands forecast results if they are contemplating adding or subtracting channels.
All that being said, the findings for brand marketers who can contemplate cross-channel campaigning and spend millions per year are stark.
The pendulum appears to have swung too far and too fast away from TV, with other elements of AV (online video, cinema) not being utilised fully enough.
All this means, potentially, billions of pounds of growth for UK-based brands are being left on the table.
The devil is in the detail
Now, some important caveats to this analysis need to be made.
The payback data does not account for production costs, which will vary by channel and are probably highest in TV.
This data is built for large brands. The companies whose spend forms the MMN dataset have invested across multiple channels for years and can afford regular econometric analysis of their media mix. Most of these brands enjoy prompted awareness levels north of 65%. So this is not the best data to use to optimise a small business.
Furthermore, econometric study of advertising spend isn’t foolproof. For instance, JCDecaux has recently identified a potential problem with econometric analysis of OOH, citing a significant under-reporting of success due to the difficulty in producing accurate impact-level data at a national level, albeit from a very small sample size of brands.
This is symptomatic of a larger issue with cross-channel mix marketing modelling — you are not comparing apples with apples when it comes to advertising delivery.
The TV-shaped elephant in the room
And, finally, we must address the elephant in the room: a tool housed on the Thinkbox website recommending high levels of TV spend? Shock horror!
Well, the dataset here is collated from brands’ own econometric data, across a series of agencies and auditors. No data capture or analysis has been undertaken by Thinkbox itself.
Ebiquity and WPP, brands that trade on their neutrality in media, have done the work and built this tool. And, let’s be clear, Profit Ability 2 isn’t all that kind to TV, stating pay-per-click outperforms it in immediate-term return on investment (ROI) and that linear TV ROI has gone backwards since the pandemic.
So this is not effectiveness through TV-tinted glasses.
If you’re keen to evolve your media mix to optimise growth, you can use the revamped Media Mix Navigator for free at the Thinkbox website.
 Richard Kirk is chief strategy officer at EssenceMediacom UK